Asia Day Ahead: ASX on near-term exhaustion, AUD/USD reclaimed 200-day MA
After four straight week of gains, major US indices have been stuck in a holding pattern lately but market participants may not have to wait long.


Market Recap
The return from the US holiday saw Wall Street close mostly flat overnight (DJIA -0.16%; S&P 500 -0.20%; Nasdaq -0.07%), while the intraday session displayed some whipsaws as a reflection of near-term indecision. After four straight week of gains, major US indices have been stuck in a holding pattern lately but market participants may not have to wait long, with a series of key economic data (US gross domestic product (GDP), US core personal consumption expenditures (PCE)) ahead this week to drive market direction.
US Treasury yields continued their declines in the aftermath of yesterday’s auction, with the US 10-year yields reversing from the 4.50% level to 4.40%, while the US two-year yields moderated to 4.90%. Weaker US economic data may play a part in keeping yields down as well, with a much lower-than-expected new home sales data (679,000 versus 725,000 expected) reflecting the impact from elevated borrowing costs. The Dallas Federal Reserve (Fed) manufacturing index also registered its four-month low (-19.9 versus previous -19.2), with softer economic conditions further validating the Fed decision to keep rates on hold.
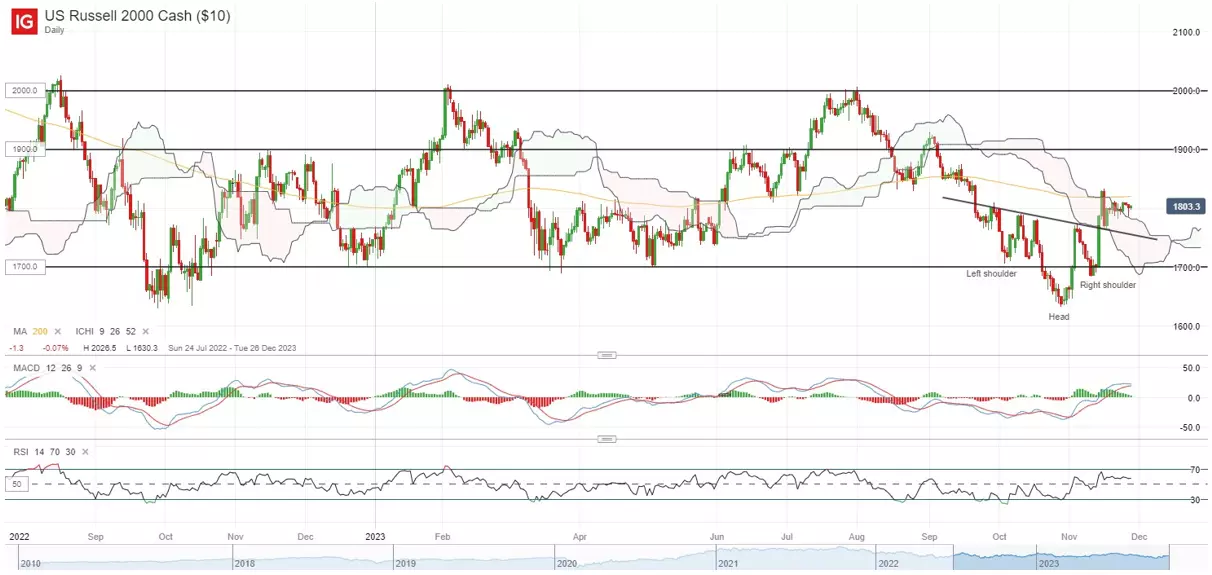
Perhaps one may watch for the Russell 2000, which has been consolidating just below its key 200-day moving average (MA) while retesting the upper edge of its Ichimoku cloud resistance on the daily chart. A breakout of an inverse head-and-shoulder formation still remains in play, which reflects buyers taking on greater control. Nevertheless, a move above its 200-day MA may provide further conviction of a continuation of its near-term upward trend, which may leave the 1,900 level in sight next.
Asia Open
Asian stocks look set for a mixed open, with Nikkei -0.24%, ASX +0.63% and KOSPI +0.37% at the time of writing. Nevertheless, overall sentiments could attempt to tap on the weaker US dollar and lower Treasury yields for a drift higher, while awaiting further data releases this week for greater cues.
The economic calendar this morning brought a lower-than-expected read from Australia’s October retail sales (-0.2% versus 0.1% forecast), which will validate market expectations for rates to be kept on hold next week. Eyes will now fall on the key Australia’s inflation data out tomorrow to provide further confirmation, with expectations looking for the monthly consumer price index (CPI) indicator to fall to 5.2% YoY from 5.6% in September.
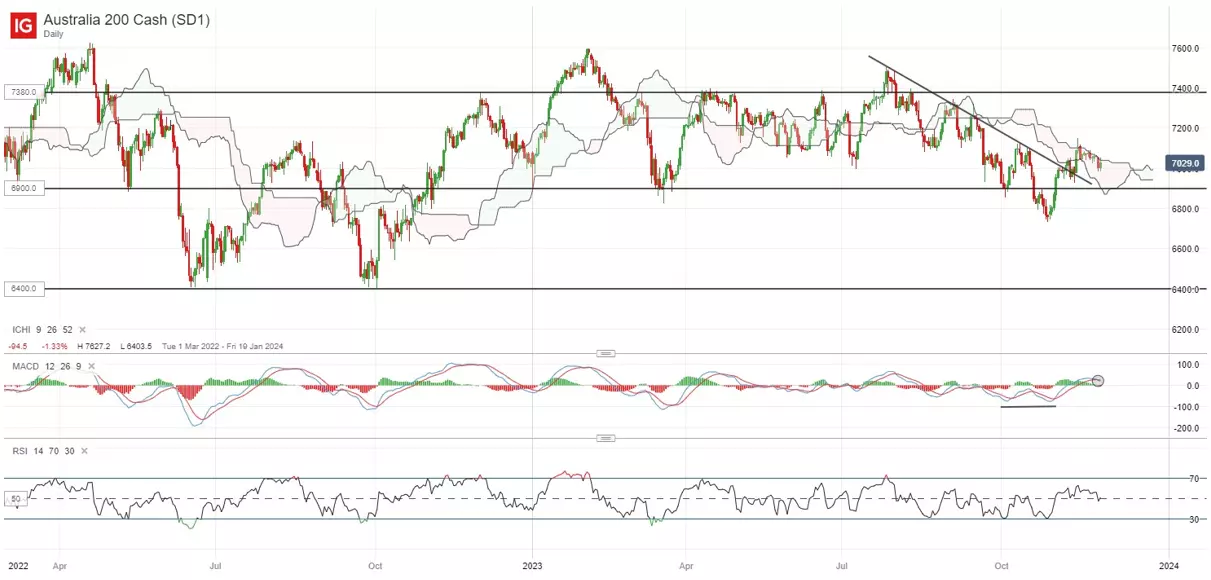
The ASX 200 has broken above a downward trendline resistance in early-November this year, but are facing some near-term exhaustion as it nears the upper edge of its Ichimoku cloud resistance on the daily chart. The 7,100 level may be immediate resistance to overcome ahead, with any close above the cloud resistance also on watch to reflect greater control from buyers. On the downside, the 6,950 level will be near-term support to hold.
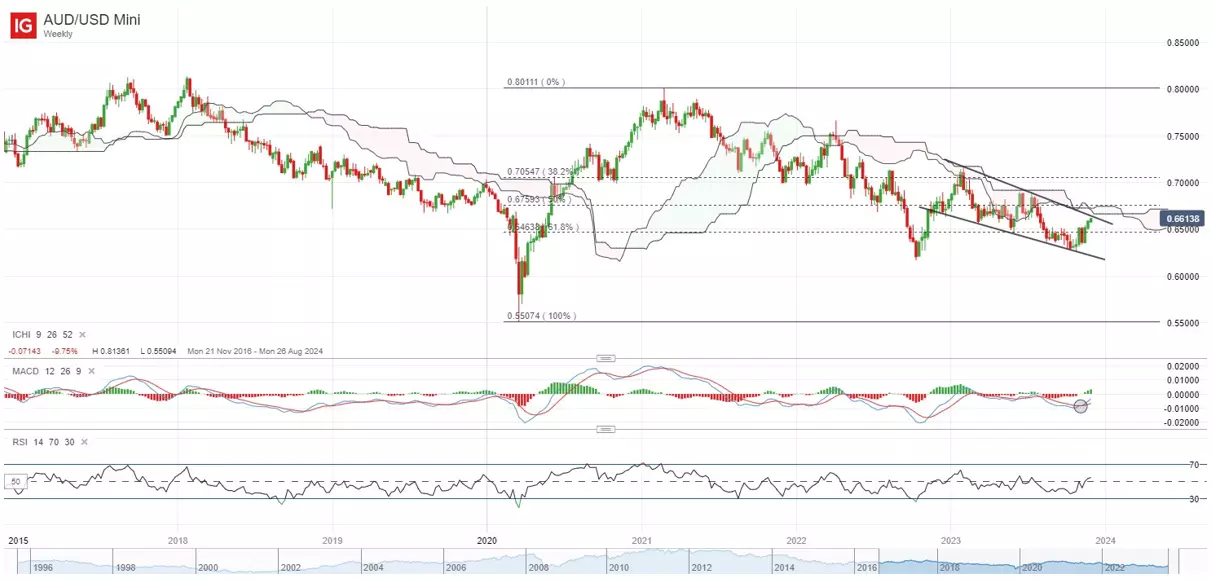
On the watchlist: AUD/USD reclaimed its 200-day MA for first time in four months
The AUD/USD has gained for its fourth straight trading day, tapping on a near two-month low in the US dollar to reclaim its 200-day MA for the first time since July 2023. Sustaining above the MA-line will be key for buyers now, with a bullish crossover displayed on its weekly moving average convergence/divergence (MACD) as a sign of reversing momentum to the upside.
The 0.676 level will provide the next test of resistance, where the upper edge of its weekly Ichimoku cloud stands. Since November 2021, the pair has failed to move above the cloud, facing strong resistance on at least four previous occasions. Overcoming this level may provide further conviction of a trend reversal to the upside and leave the 0.705 level on watch next.
Monday: DJIA -0.16%; S&P 500 -0.20%; Nasdaq -0.07%, DAX -0.39%, FTSE -0.37%
IGA, may distribute information/research produced by its respective foreign affiliates within the IG Group of companies pursuant to an arrangement under Regulation 32C of the Financial Advisers Regulations. Where the research is distributed in Singapore to a person who is not an Accredited Investor, Expert Investor or an Institutional Investor, IGA accepts legal responsibility for the contents of the report to such persons only to the extent required by law. Singapore recipients should contact IGA at 6390 5118 for matters arising from, or in connection with the information distributed.
The information/research herein is prepared by IG Asia Pte Ltd (IGA) and its foreign affiliated companies (collectively known as the IG Group) and is intended for general circulation only. It does not take into account the specific investment objectives, financial situation, or particular needs of any particular person. You should take into account your specific investment objectives, financial situation, and particular needs before making a commitment to trade, including seeking advice from an independent financial adviser regarding the suitability of the investment, under a separate engagement, as you deem fit.
No representation or warranty is given as to the accuracy or completeness of this information. Consequently, any person acting on it does so entirely at their own risk. Please see important Research Disclaimer.
Please also note that the information does not contain a record of our trading prices, or an offer of, or solicitation for, a transaction in any financial instrument. Any views and opinions expressed may be changed without an update.

Seize a share opportunity today
Go long or short on thousands of international stocks.
- Increase your market exposure with leverage
- Get spreads from just 0.1% on major global shares
- Trade CFDs straight into order books with direct market access
Live prices on most popular markets
- Forex
- Shares
- Indices
See more forex live prices
See more shares live prices
Prices above are subject to our website terms and agreements. Prices are indicative only. All shares prices are delayed by at least 15 mins.
See more indices live prices
Prices above are subject to our website terms and agreements. Prices are indicative only. All shares prices are delayed by at least 20 mins.
