WALL STREET UPDATE
US equity markets face volatility as trade tensions escalate and Fed signals loom
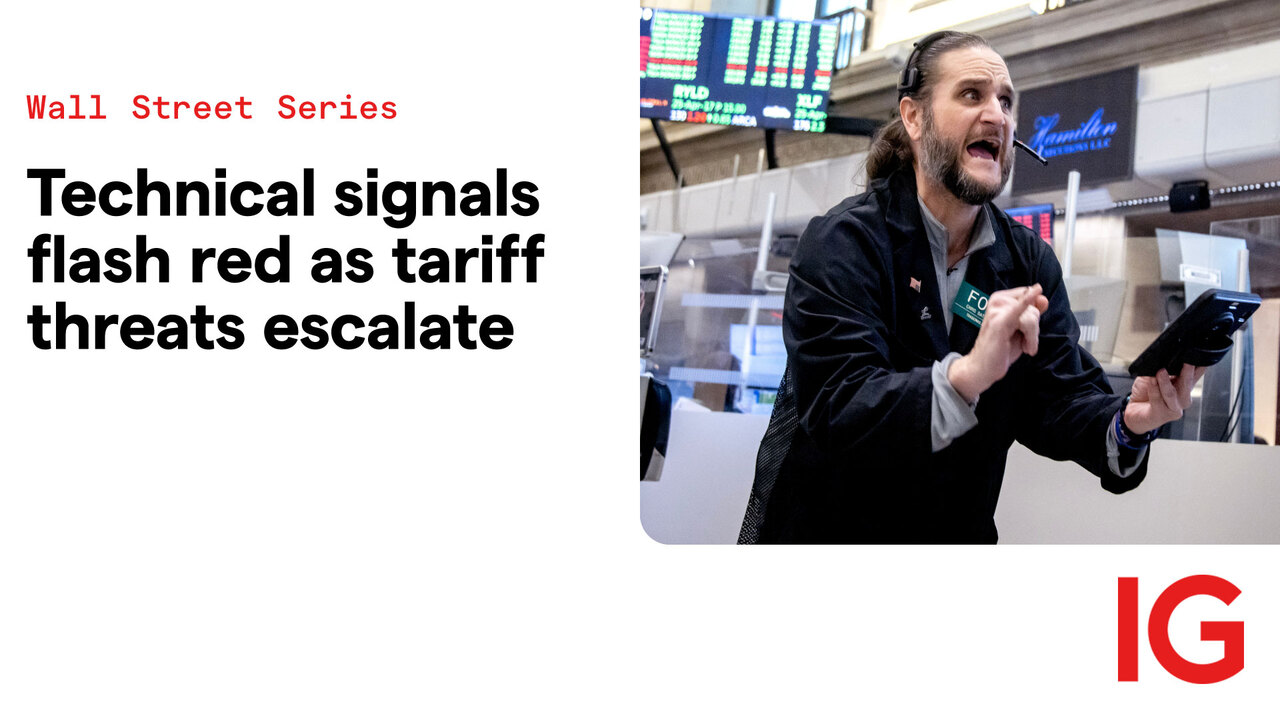
US equity markets dipped last week as renewed global trade tensions and tariff hikes dampened sentiment ahead of earnings season, Federal Reserve commentary, and key inflation data.


Trade tensions weigh on Wall Street despite modest losses
United States (US) equity markets closed lower last week as trade tensions resurfaced on Monday and intensified throughout the week.
For the week:
- US 500 ( S&P 500) fell 0.31%
- US Tech 100 (Nasdaq 100) slipped 0.38%,
- Wall Street (Dow Jones) declined 457 points (−1.02%).
These modest declines likely reflect the widely held view that tariff threats are primarily a negotiation tactic designed to pressure trading partners into finalising trade agreements.
Global tariffs escalate as US targets major trade partners
To recap, last week began with ‘tariffs in letters’ sent to mostly minor trading partners (apart from Japan and South Korea), before tensions escalated with a sharp increase in Brazil’s tariff rate, threats of baseline tariffs of 15% – 20%, and the announcement of a 35% tariff on Canada.
After markets closed on Friday, President Trump announced a 30% tariff on imports from Mexico and the European Union (EU), effective 1 August. It is worth noting that, together, Canada, Mexico and the EU account for roughly 45% of all imports into the US.
In the unlikely event that there is no reduction in the tariffs announced last week, the average tariff rate is expected to rise to nearly 25%, up from the current rate of around 14%. This would have serious implications for growth, inflation, and consumer and business confidence. However, this impact will not fully materialise in economic data until September and October, with the relevant releases due in October and November.
Earnings, Fed speakers and inflation data in focus this week
Looking ahead, aside from monitoring tariff headlines, this week’s focus will be on earnings reports from major banks including JP Morgan Chase, Goldman Sachs and Bank of America, as well as Netflix and 3M. The consensus expects US 500 earnings per share (EPS) growth of 4.8% – 5.2% in the second quarter (Q2), which is well below the 12% year-on-year (YoY) growth seen in the first quarter (Q1), and a benchmark that corporate America should clear with ease.
Elsewhere, speakers from the Federal Reserve (Fed) – including Bowman, Barr, Barkin, Collins, Logan, Hammack, Williams, Kugler, Cook and Waller – are scheduled to speak ahead of the blackout period before the Fed’s July meeting. There will also be strong interest in Tuesday’s consumer price index (CPI) report for June, previewed below.
CPI
Date: Tuesday, 15 July at 10.30pm AEST
In May, the headline inflation rate rose 0.1% month-on-month (MoM), which saw the annual rate of headline inflation increase for the first time in four months to 2.4%, up from 2.3%. Core inflation also rose 0.1% MoM, with the annual rate holding steady at 2.8% year on year (YoY) for a third consecutive month. This was below forecasts, which had predicted a rise to 2.9%.
The minutes from the June meeting of the Federal Open Market Committee (FOMC) were released last week. The minutes reaffirmed the belief that interest rates are ‘well positioned to wait for more clarity’. Participants noted that increased tariffs would likely place upward pressure on prices, with ‘a few’ indicating tariffs would cause a one-off price increase, but ‘most’ highlighting the risk of more persistent inflationary effects. ‘Most’ participants felt a rate cut this year would be appropriate, with ‘a couple’ open to cuts as early as the next meeting. However, ‘some’ participants saw no cuts this year, citing ‘meaningful’ upside risks to inflation.
For June, the preliminary expectation is for headline inflation to rise 0.3% MoM, with the annual rate increasing to 2.7%. Core inflation is also expected to rise 0.3% MoM, which would lift the annual rate to 3% – the highest since February. This rise is largely expected to reflect the effects of tariffs and is not anticipated to trigger a period of sustained volatility.
The US interest rate futures market is currently pricing in 18 basis points (bp) of Fed rate cuts for the September FOMC meeting, with a cumulative 52 bp of cuts priced in between now and the end of the year.
US core inflation chart

US tech 100 technical analysis
Following the US Tech 100’s strong upward movement on 12 May, we have been working with the view that the rally from the 21 April low of 17,592 is a Wave III according to Elliott Wave theory, to be followed by a Wave IV pullback.
The rebound in late June from the key 21,500 to 21,450 support zone opened the way for the index (Wave III) to push to record highs and come within a short distance of major weekly trend channel resistance at 23,300. Notably, a weekly loss-of-momentum candle formed last week ahead of this resistance level.
From here, a sustained break below short-term support at 22,550 would be an initial sign that Wave III has completed and that a Wave IV pullback is underway. The initial target for Wave IV is a band of support near 22,000, with a sustained break below that level opening the way for a deeper Wave IV move towards support at 21,500 to 21,300.
US tech 100 daily chart

US 500 technical analysis
Following the US 500’s sharp move higher on 12 May, we have been working with the view that the rally from the 21 April low of 5101 is a Wave III in Elliott Wave terms, to be followed by a Wave IV pullback.
The rebound in late June from the key 5950 to 5920 support zone allowed the US 500 (Wave III) to push to new highs. However, with the US Tech 100 now near critical resistance and both the US Tech 100 and US 500 forming weekly loss-of-momentum candles last week, it is time to reassess the levels that might indicate a Wave IV pullback is beginning.
Specifically, a sustained break below short-term support at 6200 to 6180 would be an initial sign that Wave III has completed and that a Wave IV pullback is underway. The initial target for Wave IV is a support zone in the 6150 to 6130 range, derived from previous highs, with a sustained break below this level potentially leading to a deeper Wave IV decline towards support at 5970 to 5950.
US 500 daily chart

- Source: TradingView. The figures stated are as of 14 July 2025. Past performance is not a reliable indicator of future performance. This report does not contain and is not to be taken as containing any financial product advice or financial product recommendation.
Important to know
This information has been prepared by IG, a trading name of IG Australia Pty Ltd. In addition to the disclaimer below, the material on this page does not contain a record of our trading prices, or an offer of, or solicitation for, a transaction in any financial instrument. IG accepts no responsibility for any use that may be made of these comments and for any consequences that result. No representation or warranty is given as to the accuracy or completeness of this information. Consequently any person acting on it does so entirely at their own risk. Any research provided does not have regard to the specific investment objectives, financial situation and needs of any specific person who may receive it. It has not been prepared in accordance with legal requirements designed to promote the independence of investment research and as such is considered to be a marketing communication. Although we are not specifically constrained from dealing ahead of our recommendations we do not seek to take advantage of them before they are provided to our clients.
Ready to open an IG account?
Start your trading journey now
Connect with us
Disclaimers:
- All forms of investments carry risks, including the potential loss of all or part of your principal amount invested. The value of an investment product may rise or fall, and may also become valueless. Past performance is not indicative of future results. Please ensure that you fully understand, and are aware of, the risks and costs involved.
- Trading CFDs may not be suitable for everyone. CFDs are leveraged instruments and can result in losses that exceed deposits. Refer to the Risk Disclosure Statement and Risk Fact sheet.
- IG Asia Pte Ltd (Co. Reg. No. 200510021K)("IG") is regulated by the Monetary Authority of Singapore and holds a capital markets services licence.
- IG provides an execution-only service. The information in this advertisement does not contain (and should not be construed as containing) investment advice or an investment recommendation, or an offer of or solicitation for a transaction in any financial instrument. IG accepts no responsibility for any use that may be made of these comments and for any consequences that result. You should consider your specific investment objectives, financial situation or particular needs before making a commitment to trade, including seeking advice from an independent financial adviser regarding the suitability of the investment, under a separate engagement, as you deem fit.
- The information on this site is not directed at residents of the United States or Belgium and is not intended for distribution to, or use by, any person in any country or jurisdiction where such distribution or use would be contrary to local law or regulation.
- This advertisement has not been reviewed by the Monetary Authority of Singapore.
