What is mean reversion and how does it work?
Mean reversion is a popular trading strategy employed by investors and traders - it proposes that asset prices tend to revert to their moving average. Read on to learn more about how the concept works in practice.

What is mean reversion?
Mean reversion is a key concept in trading theory which posits that prices tend to return to average levels, as extreme price moves – both up and down – are hard to sustain for extended periods of time.
Traders who use mean reversion in their strategy have developed multiple ways of capitalising on the theory. But the core belief is that in every trade, they are estimating that any extremity, including growth, price or volatility, will return to the average over time.¹
How does the mean reversion trading strategy work?
Mean reversion strategies involve attempts to generate a profit by trading on an asset as it returns closer to its average and away from an extreme. Traders use these approaches when performing a statistical analysis of market conditions – they are usually viewed as one component of an overarching strategy.
Traders also often use mean reversion analysis as a tool to evaluate stock prices, especially where there is a disconnect between a company's market cap and its assets.
As always, there are risks – a price rising away from the average does not mean it will fall again. It may instead re-rate in the face of new facts or evidence.
This is particularly common with high-risk small-cap companies when they experience a long-awaited catalyst. The mean could even move up to meet the new price – this is also a reversion to the mean because the price is moving up to its new average. Plus, while reversion to the mean is a regular occurrence, prices rarely stay close to the mean for long.
Different types of mean reversion trading strategies
Every mean reversion trading strategy has the same goal: capturing a profit as an asset returns to more 'normal' levels (or closer to its average). Again, this is not a risk-free strategy.
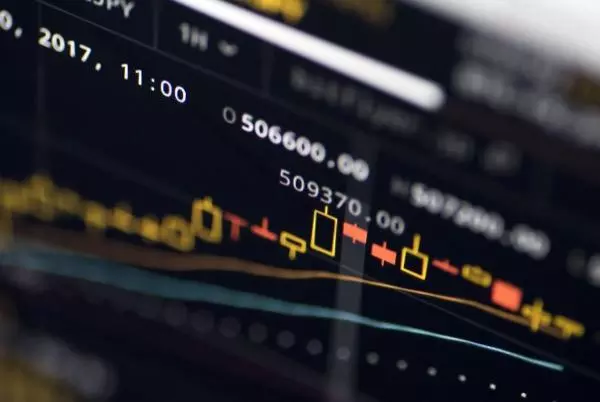
Naturally, the first concern is to calculate the mean trading price over a given number of data points in time. On an asset's chart, the mean is most easily represented by a simple moving average (SMA), which calculates the asset's average price between two data points. At its most basic, you can then consider an asset's distance from this mean to help decide when to make a trade.²
One step further, you can make use of Moving Average Convergence Divergence (MACD), a technical indicator of momentum that uses moving averages to establish a trend's strength. The MACD uses three moving averages – over the long term, the short term and the average difference between the two – to demonstrate potentially overbought or oversold price conditions. Find out more on how using MACD benefits traders.
Once you've grasped the basics, there are many further technical indicators to help hone your trading strategy. For example, Bollinger Bands use standard deviation to measure how far a price is from the mean. Here, the further the standard deviation is from the mean, the more likely the price is to revert.
Others use Keltner channels, Envelopes and regression channels. Each of these has its own specific formula for finding out when an asset's price is at its extremity and may revert back to the mean. As a caveat, no matter how sophisticated, these signals can only be used as possible indicators of where an asset may move. No strategy can guarantee returns.
Intraday mean reversion trading strategy
Intraday strategies involve buying and selling multiple assets within a single day's trading, without holding any positions overnight.
If there's an uptrend, the asset price moves up from its average and then falls back closer to it – opening up an opportunity to profit from the reversion to the mean. If there's a downtrend, the opposite occurs.
This strategy works best when a strong trend is present – trading in the same direction as a strong trend is known also known as momentum trading.³
Mean reversion in pairs trading
Pairs trading involves finding two highly correlated assets that tend to move together. This means that when one asset in the pair deviates from the other – either rising or falling out of step – you can look to profit from the likely mean reversion. This type of trading is also known as statistical arbitrage.
Pairs trading is common when trading forex pairs.
This is because when two highly correlated pairs move out of standard synchronicity, history suggests they will eventually regress to the mean.
If you're looking to profit from the divergence, you could buy the underperforming forex pair, while simultaneously shorting the stronger pair. All pairs trading requires buying and selling at the same time. It doesn't matter to the trader which asset falls or rises, as they seek to profit on the mean reversion.
Of course, if the pairs move further out of step, then losses will be incurred. Most traders use a stop-loss to limit potential losses for occasions when the strategy fails. In addition, it's important to consider limiting your risk by hedging your buying and selling depending on the pace of each asset's price movement – if one asset is rising or falling faster than the other, then one of the pair requires less exposure.
Mean reversion forex trading strategy
One common strategy to consider when forex trading is looking at how far a currency's relative value tends to deviate from its mean before reverting. This can be done using MACD or the similar Percentage Price Oscillator (PPO) strategy – a technical momentum indicator that shows the relationship between two moving averages in percentage terms.
Practically, you could enter a short position if the price increases above a common reversal level on the PPO and then drops below this level, with the target placed on the mean. To manage risk, a stop-loss would usually be placed slightly above the already-high entry point to cover the risk of loss in the event that the price continues to move away from the mean. Of course, you could enter a long position in the opposite situation.
How to trade using mean reversion
- Create an account or log in
- Learn more about mean reversion
- Choose CFDs and search for your opportunity
- Select 'buy' to go long or 'sell' to go short
- Set your position size and take steps to manage your risk
- Open and monitor your position
With CFD trading, you predict price movements rather than own the shares yourself. This process is leveraged, so you could gain or lose money quickly – including the potential to lose more than your deposit. It's a good idea to keep in mind that when you're making your predictions, past performance isn't a guarantee of future patterns.
Learn more about the differences between trading and investing.
New to investing or trading? Practise on a demo account to build your confidence.
Pros and cons of mean reversion
There are advantages and disadvantages with every trading strategy, and mean reversion is no exception. It's up to the individual to assess their own skill level, investing goals and risk attitude to consider whether this popular approach is suitable.
Pros of mean reversion
- Allows investors to profit when markets are unusually volatile. Many found success using this strategy after the 2008 global financial crisis and the 2020 pandemic crash left markets in disarray
- Positions don't need to be held for long periods, usually requiring a holding period of a few days
- Skilled traders argue they can generate reliable profits more than offset the occasional loss
- Famous value investors like Warren Buffett employ strategies similar to mean reversion when making decisions. This is a popular and easy-to-understand strategy, not an arcane method
- Beginners can start with the basics of the simple moving average, then upskill over time as their knowledge grows
Cons of mean reversion
- Mean reversion, like all market strategies, is not foolproof. Failures are sometimes for obvious reasons, such as a fundamental asset re-rate, but often an asset moves unpredictably for no concrete reason
- On the other hand, the efficient market hypothesis posits that stock prices always reflect all available company information – this renders the mean reversion technique higher-risk than it may appear
- The strategy only works in periods of volatility, requiring significant price fluctuations
- If you're buying shares to take advantage of depressed prices, there can often be paper losses before seeing a return to profitability. This can be psychologically difficult
- If you're taking advantage of leveraged trading, you may need a lot of capital to ride out volatility
Mean reversion summed up
- Mean reversion suggests that asset prices tend to return to average levels, as extreme price moves are hard to sustain for extended periods of time
- The mean reversion theory has led to many investment strategies and the development of several complex technical tools
- The strategy tries to capitalise on an asset's extreme price changes on the assumption that it will eventually revert to its previous state
- Like all strategies, mean reversion is not foolproof, and managing risk using a stop-loss is commonly advised
- You can either buy shares or trade on leverage when using the strategy
Sources
1. Mean Reversion - Overview, Trading, Impact of Catalysts – Corporate Finance Institute
2. Mean Reversion Trading Strategies and Backtest (Pros And Cons Of Mean Reverting Systems & Indicators) – Quantified Strategies
3. Mean Reversion Trading Strategy With A Sneaky Secret – Trading Strategy Guides
This information has been prepared by IG, a trading name of IG Markets Limited. In addition to the disclaimer below, the material on this page does not contain a record of our trading prices, or an offer of, or solicitation for, a transaction in any financial instrument. IG accepts no responsibility for any use that may be made of these comments and for any consequences that result. No representation or warranty is given as to the accuracy or completeness of this information. Consequently any person acting on it does so entirely at their own risk. Any research provided does not have regard to the specific investment objectives, financial situation and needs of any specific person who may receive it. It has not been prepared in accordance with legal requirements designed to promote the independence of investment research and as such is considered to be a marketing communication. Although we are not specifically constrained from dealing ahead of our recommendations we do not seek to take advantage of them before they are provided to our clients.

Explore the markets with our free course
Discover the range of markets and learn how they work - with IG Academy's online course.
