Spinning top candlestick: a trader's guide
The spinning top candlestick is an easy formation to recognise and can be helpful in determining whether a price reversal might occur. Learn more about this pattern and how you can trade when you recognise it.


What is the spinning top candlestick chart pattern?
The spinning top candlestick chart pattern is a formation that occurs when buyers and sellers balance each other out, resulting in similar opening and closing price levels. Because of this relatively small change in market direction, this candlestick is known as a continuation pattern.
There are two variations of this chart pattern: the bullish spinning top (green in colour) and the bearish spinning top (red in colour). The bullish formation occurs when the closing price is higher than the opening price, while the bearish pattern occurs when the opening price is higher than the closing price.
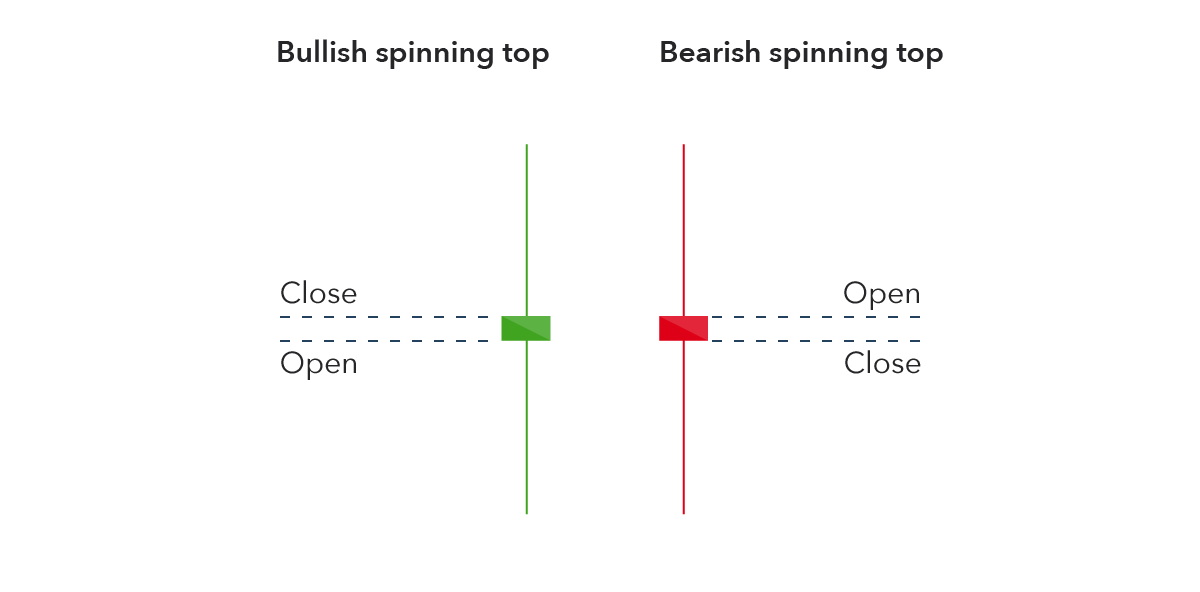
Like all candlestick patterns, the spinning top has a wick and a body:
- The wick is formed by the vertical line, while the body is formed by the horizontal lines
- The length of the wick can vary, as the top represents the highest price and the bottom represents the low
- The body can vary in height, too, as it represents the difference between the opening and closing price
How is a spinning top candlestick formed?
A spinning top candlestick is formed when the bulls send the price higher than the opening price, and the bears then push it back down before the market closes. Or, when bearish traders push prices lower than the open price and bullish traders push it back up before the market closes.
In other words, the market has explored upward and downward options but then settles at more or less the same opening price – resulting in no meaningful change.
What does a spinning top tell traders?
A spinning top tells traders that there is uncertainty in the market, because there wasn’t much of a change between the opening and closing price. This can either mean that more neutral movements are ahead, or a price reversal is about to occur.
If the spinning top is seen at the bottom of a downtrend, it could mean that a bullish reversal might happen. Conversely, if it occurs at the top of an uptrend, it could signal bearish reversal.
However, traders should not act on any candlestick pattern without considering other forms of technical analysis. Always consider other patterns and indicators, confirm the signal, and make sure not to stray from your trading plan and risk management strategy.
How to trade when you see the spinning top candlestick pattern
There are a few ways to trade when you see the spinning top candlestick pattern. The first important step is to confirm the signal. Most traders use technical indicators to confirm what they believe a spinning top is signalling, because these indicators can provide more insight into price trends.
For example, if you think a spinning top at the bottom of a downtrend could indicate an upcoming reversal, you could test the signal using the stochastic oscillator. This indicator can help you to predict price movements because it shows the speed and momentum of the market over a specific timeframe. If the upcoming reversal is confirmed, you may want to buy (go long).
To trade when you see the spinning top candlestick pattern, you can use derivatives such as spread bets or CFDs. With derivatives, you don’t take ownership of the underlying assets, but speculate on their price movements. This means you can trade rising and falling markets to take action after both bullish and bearish spinning tops.
Follow these steps to trade when you see the spinning top candlestick chart pattern:
- Create an IG trading account or log in to your existing account
- Type in the name of the asset you want to trade in the search bar
- Enter your position size
- Select ‘buy’ or ‘sell’ in the deal ticket
- Confirm the trade
You can practise trading using the spinning top chart pattern with an IG demo account. You’ll be able to open and close positions in a risk-free environment with £10,000 in virtual funds.
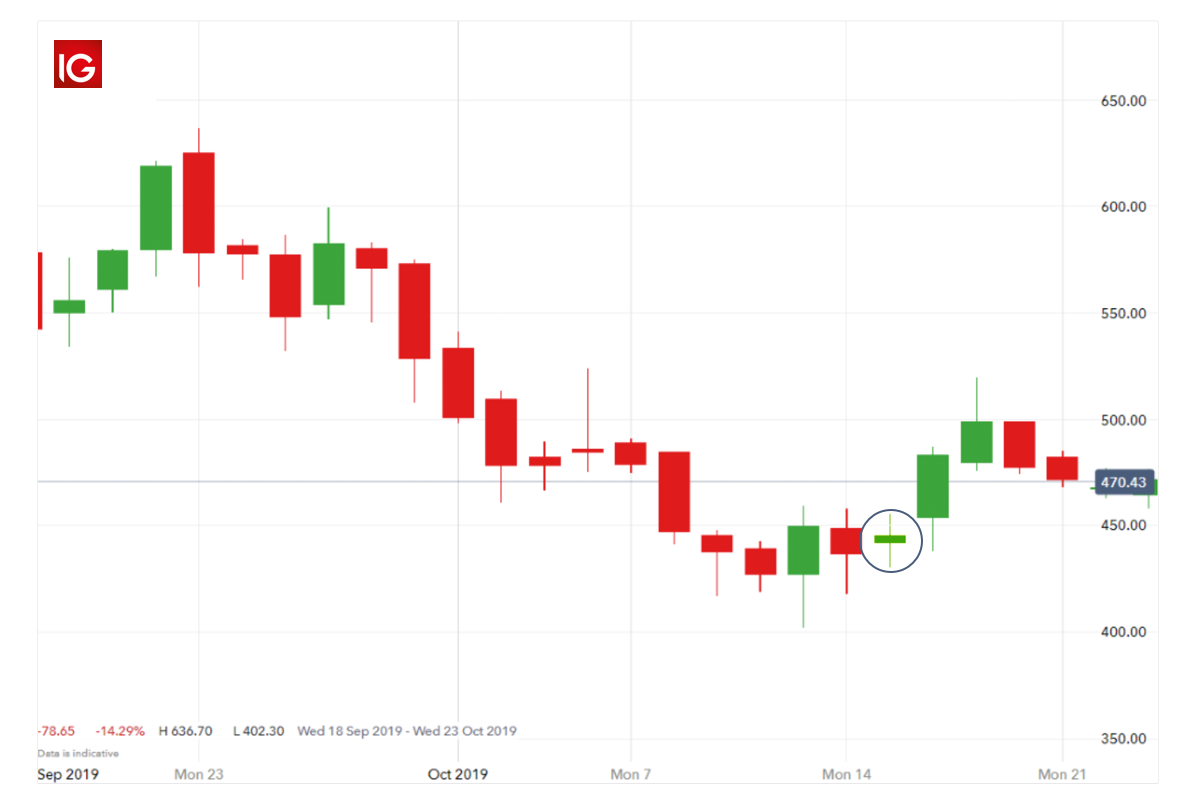
Spinning top chart pattern example
Let’s assume you’re following Aston Martin’s share price, which opens the trading day at 442p. As sellers enter the market, the share price starts moving, hitting a low of 430p. Buyers start to push back, and the share price reaches a high of 455p before the market settles and the share price closes at 445p. This creates a bullish spinning top candlestick, as pictured below.
Learn how to buy, sell and trade Aston Martin shares
Spinning top candlestick pattern summed up
- The spinning top candlestick chart pattern is a formation that occurs when an asset’s price opens and closes at a similar level – it is a sign of rest and consolidation
- The two variations of the spinning top pattern are the bullish spinning top and the bearish spinning top
- A spinning top candlestick forms when the market has explored upward and downward options but then closes at more or less the same price as its opening price
- When you see the spinning top candlestick chart pattern, you can trade using derivatives such as spread bets or CFDs
- With derivatives, you can go long or short because you do not own the underlying asset
Are you ready to start trading? Open a live IG account or sign up for a demo account.
This information has been prepared by IG, a trading name of IG Australia Pty Ltd. In addition to the disclaimer below, the material on this page does not contain a record of our trading prices, or an offer of, or solicitation for, a transaction in any financial instrument. IG accepts no responsibility for any use that may be made of these comments and for any consequences that result. No representation or warranty is given as to the accuracy or completeness of this information. Consequently any person acting on it does so entirely at their own risk. Any research provided does not have regard to the specific investment objectives, financial situation and needs of any specific person who may receive it. It has not been prepared in accordance with legal requirements designed to promote the independence of investment research and as such is considered to be a marketing communication. Although we are not specifically constrained from dealing ahead of our recommendations we do not seek to take advantage of them before they are provided to our clients.

Explore the markets with our free course
Discover the range of markets and learn how they work - with IG Academy's online course.
