Stock indices give technical buy signals after disappointing August
After a difficult month of August for stocks will the remainder of the year turn out to be more positive?


Why the August correction in equity indices is probably over?
- This week’s break through the August downtrend lines and daily chart close above last week’s highs point to an end of the August correction, according to chart analysis.
- The fact that equity indices kept rising over the past few days despite disappointing Chinese data and a cooling of the US labour market while inflation remained high in Europe seems to indicate that investors buy stocks regardless, now that they have returned from their vacations.
- Friday’s Non-Farm Payrolls (NFP), global central banks’ monetary policy and the China’s economy may, of course, still throw a spanner in the works but these events may happen further down the line.
Will a red August for stocks be followed by a green September?
Most global stock indices had a summer correction in August amid relatively low volume as investors went on holiday.
This is nothing unusual but the question on investors’ minds is whether the August correction will turn into something more nasty and whether it could last until October as was the case last year when the S&P 500 slipped by over 18% in autumn.
The difference with last year is that we were in a bear market then and that this year we have seen strong gains across the board in a clear bull market.
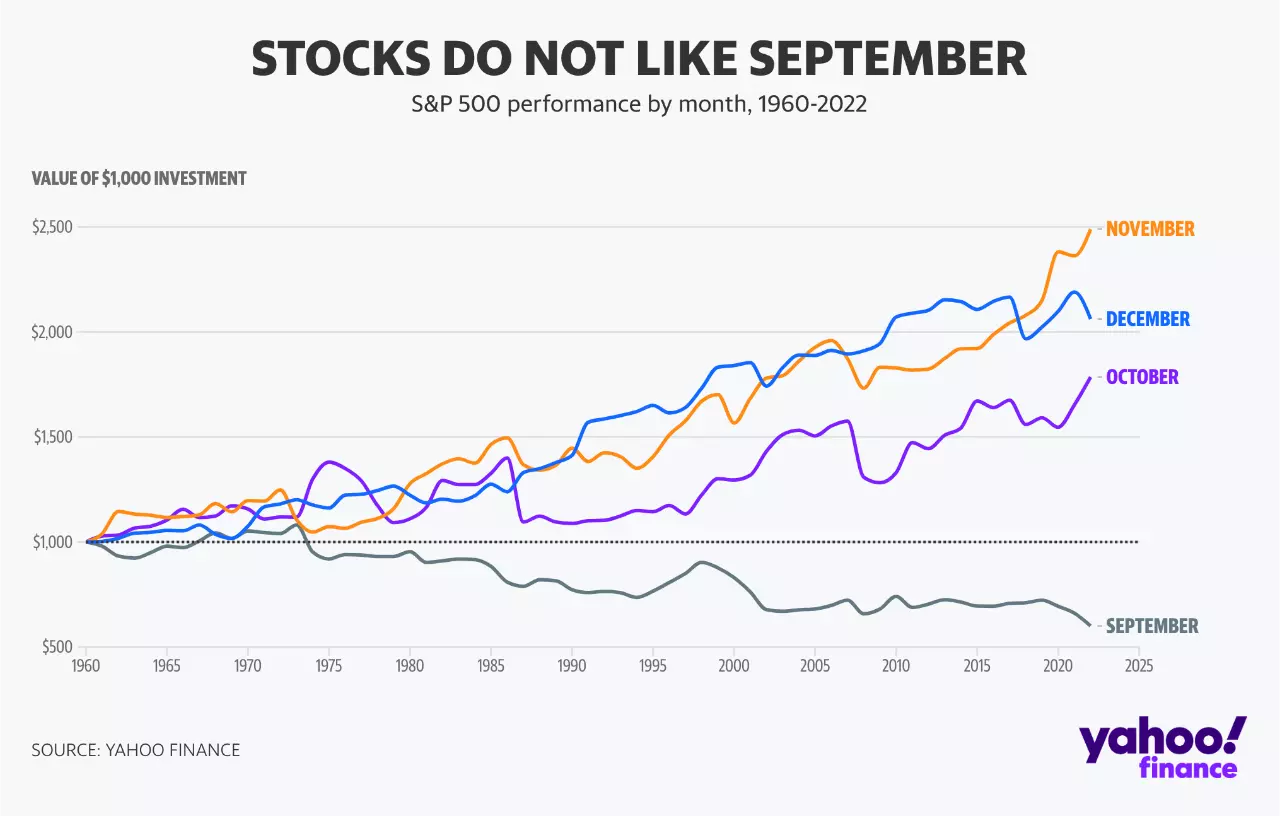
It is true that historically speaking “stocks do not like September” as this chart by Yahoo Finance shows. However, it is only an average since 1960 and within that average were times when September turned out to be a positive month.
S&P 500 performance by month between September and December from 1960 to 2022
The fact that all four major US stock indices, that is to say the Dow, Russell 2000, S&P 500 and Nasdaq 100, alongside most European counterparts, have risen above last week’s highs and in doing so broke through their August downtrend lines, is a technically speaking positive sign.
S&P 500 Daily Chart
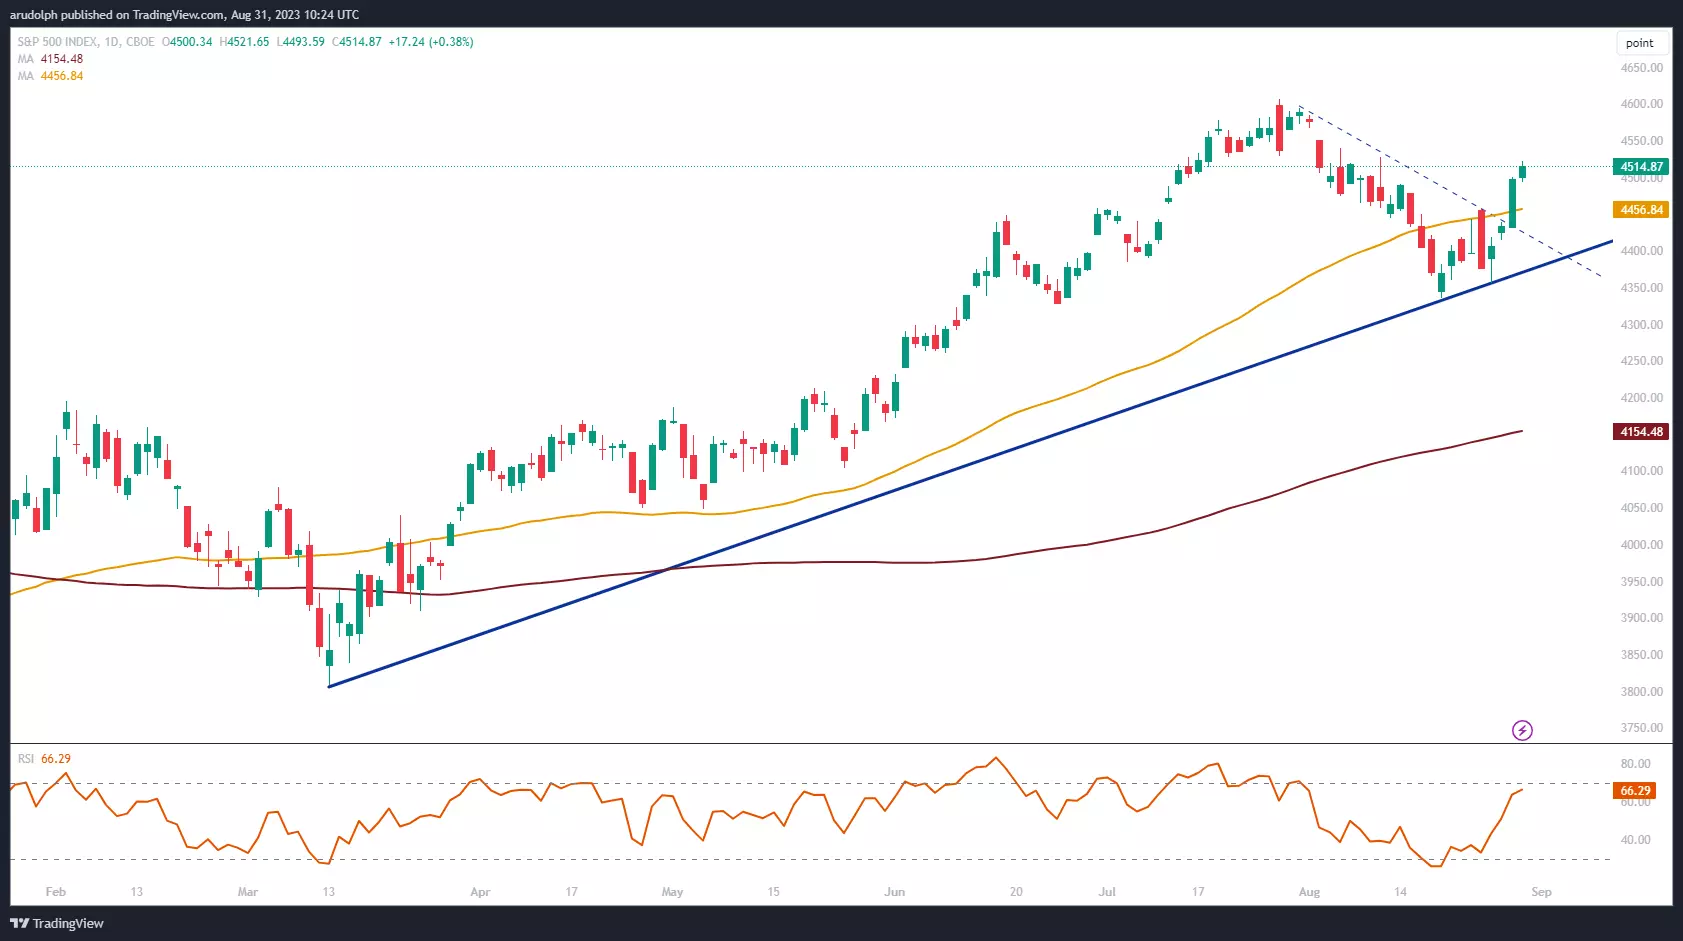
It means that, provided the August lows underpin these stock indices, a retest of the July or August highs may well ensue over the coming weeks. For the S&P 500 the technical level which needs to hold is the mid-August low at 4,335.31 with the July peak coming in at 4,607.07, around 2% higher than current levels.
Weak US growth data spurs equity investors on
The downwardly revised US Q2 gross domestic product (GDP) growth and softer-than-expected employment data out this week has been interpreted by investors as giving the Federal Reserve (Fed) the opportunity to keep its interest rates on hold. Bad data has in effect been turned into a good story for stocks.
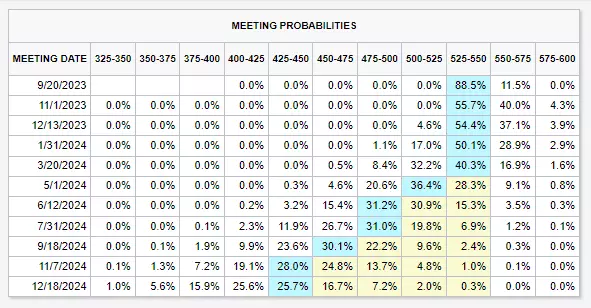
According to the FedWatch probabilities tool 88% expect to see no rate hike in September with the first rate cut expected to be seen by 36% in May 2024.
FedWatch Tool: Probabilities
Sticky Eurozone inflation hardly dampens the mood but…
Sticky Eurozone inflation at 5.3% year-on-year for the month of August, for both core and headline inflation, doesn’t seem to have done much damage to European equity indices on Thursday morning as most of these remain in the green at the time of writing.
DAX 40 Daily Chart
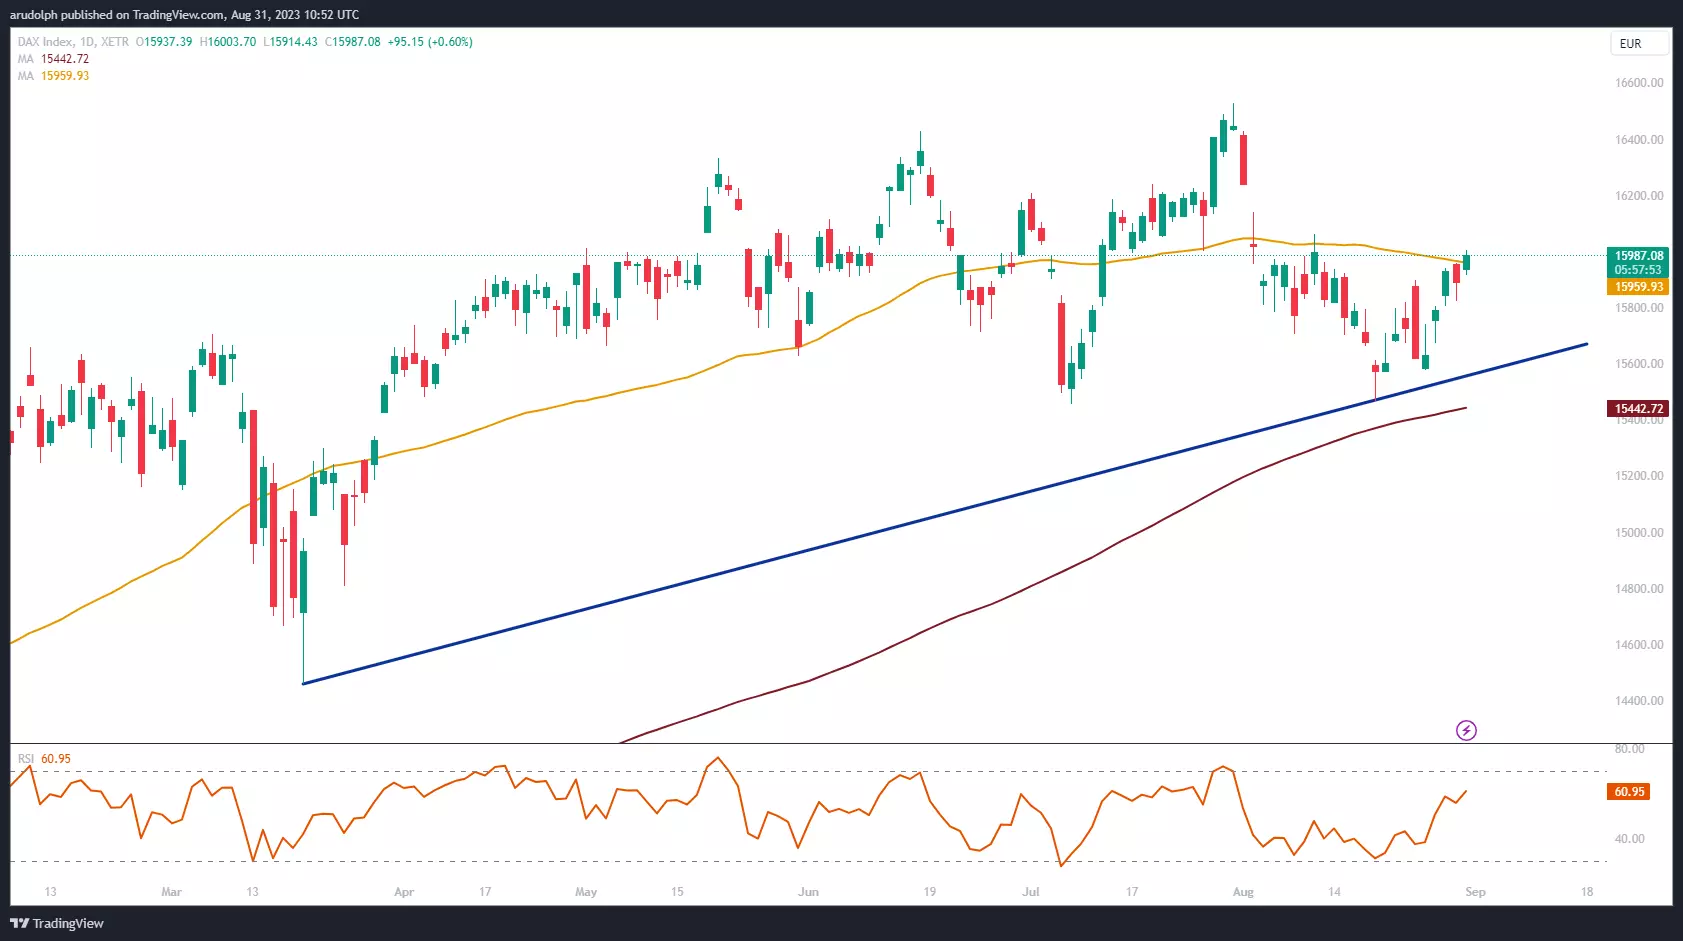
The German DAX 40 index, like several of its European counterparts, has been trading in a wide sideways trading range since April.
Even though it is also expected to have formed a bottom at its 15,468.65 mid-August five-month low and to re-integrate the upper boundaries of its large sideways trading range, it is unlikely to rise above its July peak at 16,528.97 in September.
For that to happen, a swift ascent like that seen from the July trough would need to occur, something which is unlikely to happen given seasonality.
Historically equity markets are often volatile during the months of September and October but very rarely take out previous monthly highs. This is not to say that the Dax 40 and other European stock indices cannot rise further still but that such an advance is unlikely to be a dramatic one.
Spanner in the works
The moment investors start to believe that the no longer expected recession in the US could again rear its head - given the cooling of US growth and its labour market - the above-mentioned bullish outlook could rapidly unravel.
Such a scenario looks to be more likely sometime next year, though, if at all, once rates have peaked in the US and the effect of rapidly raised interest rates on the US economy may be felt more strongly.
This information has been prepared by IG, a trading name of IG Markets Limited. In addition to the disclaimer below, the material on this page does not contain a record of our trading prices, or an offer of, or solicitation for, a transaction in any financial instrument. IG accepts no responsibility for any use that may be made of these comments and for any consequences that result. No representation or warranty is given as to the accuracy or completeness of this information. Consequently any person acting on it does so entirely at their own risk. Any research provided does not have regard to the specific investment objectives, financial situation and needs of any specific person who may receive it. It has not been prepared in accordance with legal requirements designed to promote the independence of investment research and as such is considered to be a marketing communication. Although we are not specifically constrained from dealing ahead of our recommendations we do not seek to take advantage of them before they are provided to our clients.

Take a position on indices
Deal on the world’s major stock indices today.
- Trade the lowest Wall Street spreads on the market
- 1-point spread on the FTSE 100 and Germany 40
- The only provider to offer 24-hour pricing
Live prices on most popular markets
- Forex
- Shares
- Indices
