NYSE: Is the C3.ai share price overhyped?
Technical outlook on C3.ai’s share price within its current highly volatile environment.


Is the surge higher in the C3.ai’s share price sustainable?
The C3.ai Inc (24 Hours) share has been part of the recent global Artificial Intelligence (AI) buying frenzy and has risen by more than 225% year-to-date, having previously dropped 94% from its December 2020 peak.
The C3.ai share price is thus rather volatile, to say the least.
It dropped by 13% on 1 June, for example, when the artificial intelligence software developer reported fourth quarter results, beating expectations on the top and bottom lines but offering a forecast that disappointed analysts’ expectations.
Within a matter of a week the C3.ai share price had not only recouped these losses but surged higher by nearly 30% despite some analysts being slightly worried about multiple revisions about what C3.ai claim to be their customers.
Apparently some quarters wonder about whether the technology company’s CEO Tom Siebel is perhaps exaggerating not only the company's customer base but also revenue opportunities.
When faced with exceptionally high share price volatility, such as that of C3.ai, it may make sense to trade shares with a technical rather than a fundamental approach. This way strict risk- and money management rules, such as using stop loss or even a stop and reverse orders, can be applied.
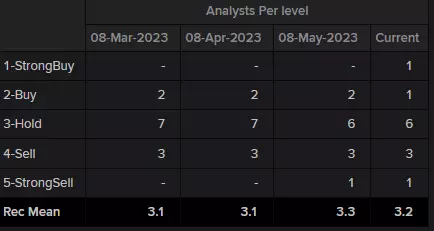
C3.ai analyst rating
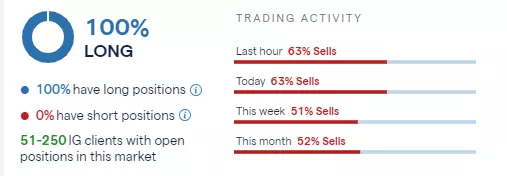
IG sentiment data shows that 100% of clients have C3.ai long positions which may point to over exuberance. Trading activity over this week and month shows 51% and 52% of sells respectively, though, but this could be due to profit taking.
C3.ai – technical view
The parabolic 157% rally in the C3.ai share price from its early May lows, boosted by better-than-expected earnings by the likes of Nvidia, and a general market AI buying frenzy, seems to have run its course.
Unless Wednesday’s high at $39.33 is overcome on a daily chart closing basis, a lower high below last week’s seven-month high at $44.02, is in the process of being formed. It would indicate that cracks are beginning to appear in the share’s bullish picture.
C3.ai Daily Chart
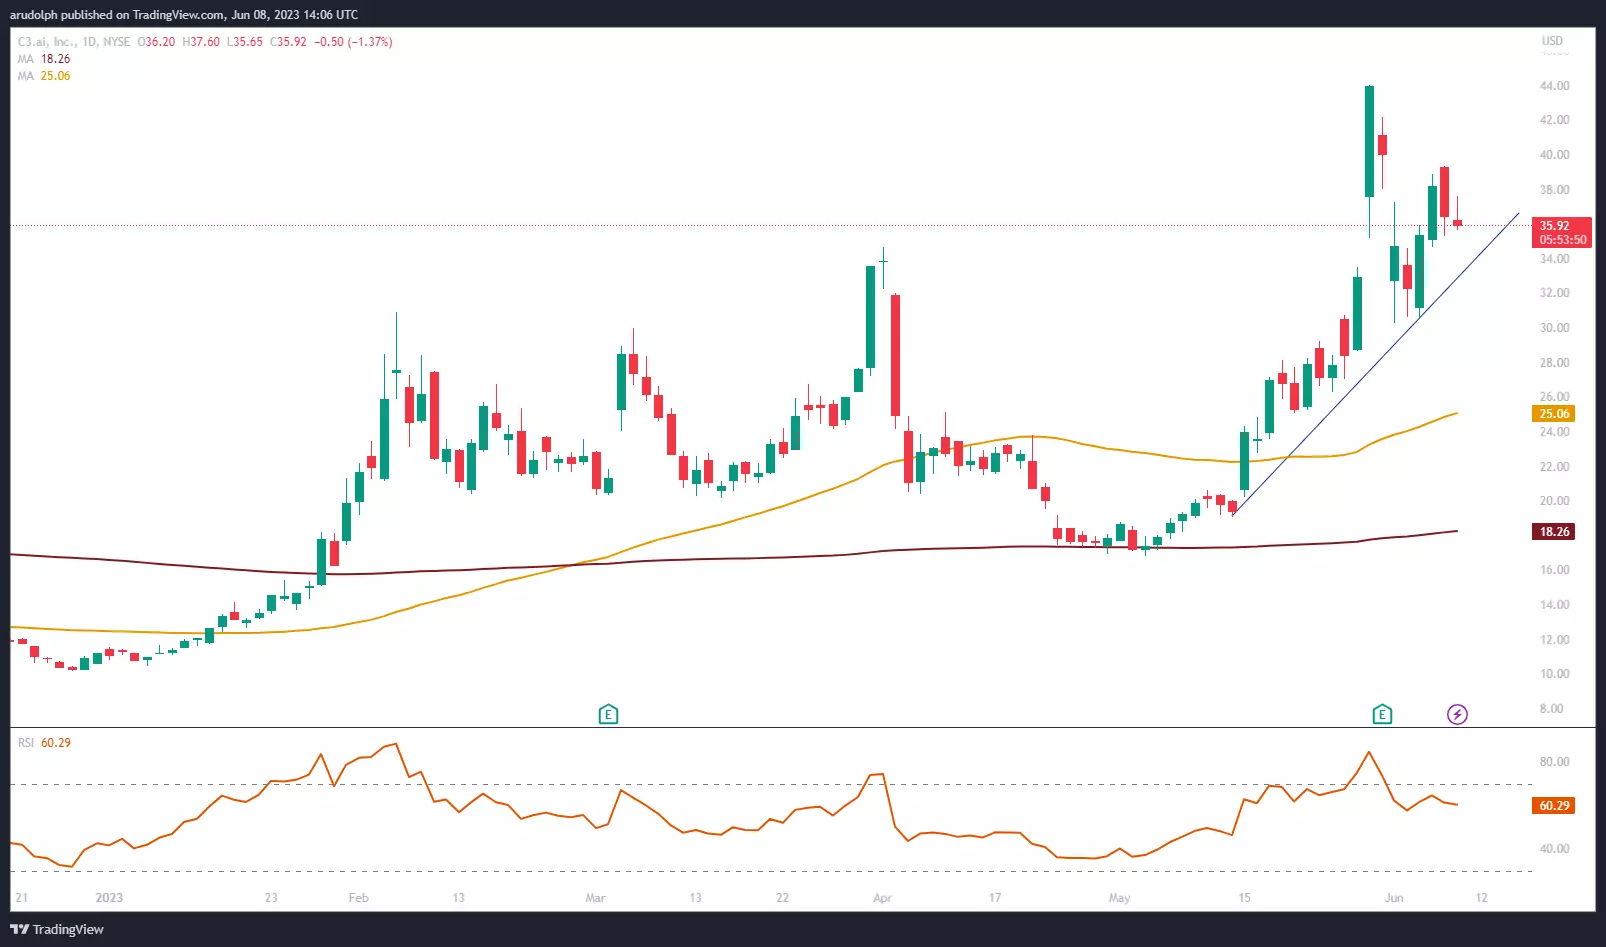
A fall through Wednesday’s $35.30 low, made close to the $34.68 April peak, would likely lead to further selling taking the C3.ai share price back down to last week’s low at $30.26 and lower still.
Even if a typical Elliott wave abc zig-zag correction were to be seen, the 55-day simple moving average (SMA) at $25.06 could be reached over the coming days, that is around 30% below the current price (as of 08 June 2023).
Given the recent high volatility in the C3.ai share price, it is probable that another interim top will soon be formed, just as was the case in April.
C3.ai Weekly Chart
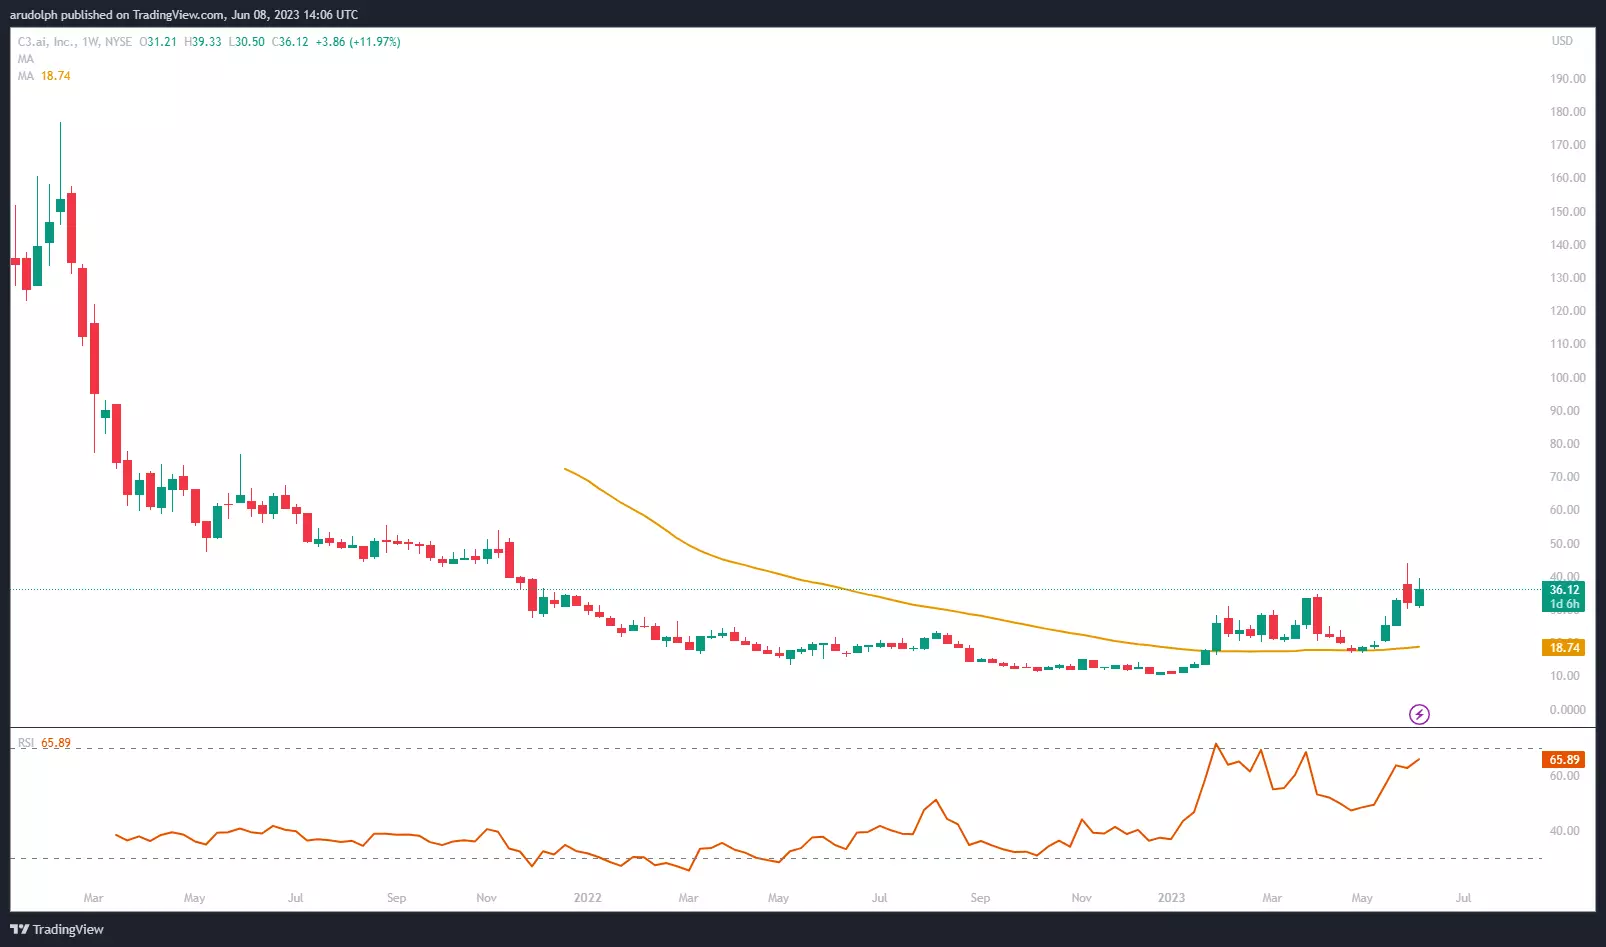
For this toppish view to become void, a rise above the late May high at $44.02 would need to be seen. Only then could the next higher November 2021 peak at $53.82 be in play.
This information has been prepared by IG, a trading name of IG Markets Limited. In addition to the disclaimer below, the material on this page does not contain a record of our trading prices, or an offer of, or solicitation for, a transaction in any financial instrument. IG accepts no responsibility for any use that may be made of these comments and for any consequences that result. No representation or warranty is given as to the accuracy or completeness of this information. Consequently any person acting on it does so entirely at their own risk. Any research provided does not have regard to the specific investment objectives, financial situation and needs of any specific person who may receive it. It has not been prepared in accordance with legal requirements designed to promote the independence of investment research and as such is considered to be a marketing communication. Although we are not specifically constrained from dealing ahead of our recommendations we do not seek to take advantage of them before they are provided to our clients.

Seize a share opportunity today
Go long or short on thousands of international stocks.
- Increase your market exposure with leverage
- Get spreads from just 0.1% on major global shares
- Trade CFDs straight into order books with direct market access
Live prices on most popular markets
- Forex
- Shares
- Indices
