Is buying the dip on the Nasdaq 100 a good idea?
Outlook on the Nasdaq 100 amid further monetary tightening while US data continue to surprise to the upside.


Is it time to buy the pullback in the Nasdaq 100 or is it too early?
Last week’s over 3% pullback by the US Tech 100 has been seen as an opportunity to “buy the dip” by many with it so far having regained nearly 2% within a couple of days.
The interesting fact is that the past couple of days’ rise has occurred despite the US’ move to limit AI chip sales to China and while the Federal Reserve (Fed) Chair Jerome Powell reaffirmed his commitment to more rate hikes.
Reasons for the advance probably were solid US new home sales, durable goods orders and consumer confidence, all of which pushed prices higher. Also, investor appetite for anything remotely connected to AI remains undimmed.
What do the charts say?
From a technical perspective the bullish break out of Tuesday’s Harami on the daily candlestick chart does indeed point towards higher prices soon being seen, provided that this week’s low at 14,687.02 underpins.
Nasdaq 100 Daily Candlestick Chart

The question is whether an advance to above last week’s 1 ½ year high at 15,284.65 can unfold?
After all the Nasdaq 100 has already risen by around 38% year-to-date and even if it is no longer overbought on the daily Relative Strength Index (RSI), it remains so on the weekly chart.
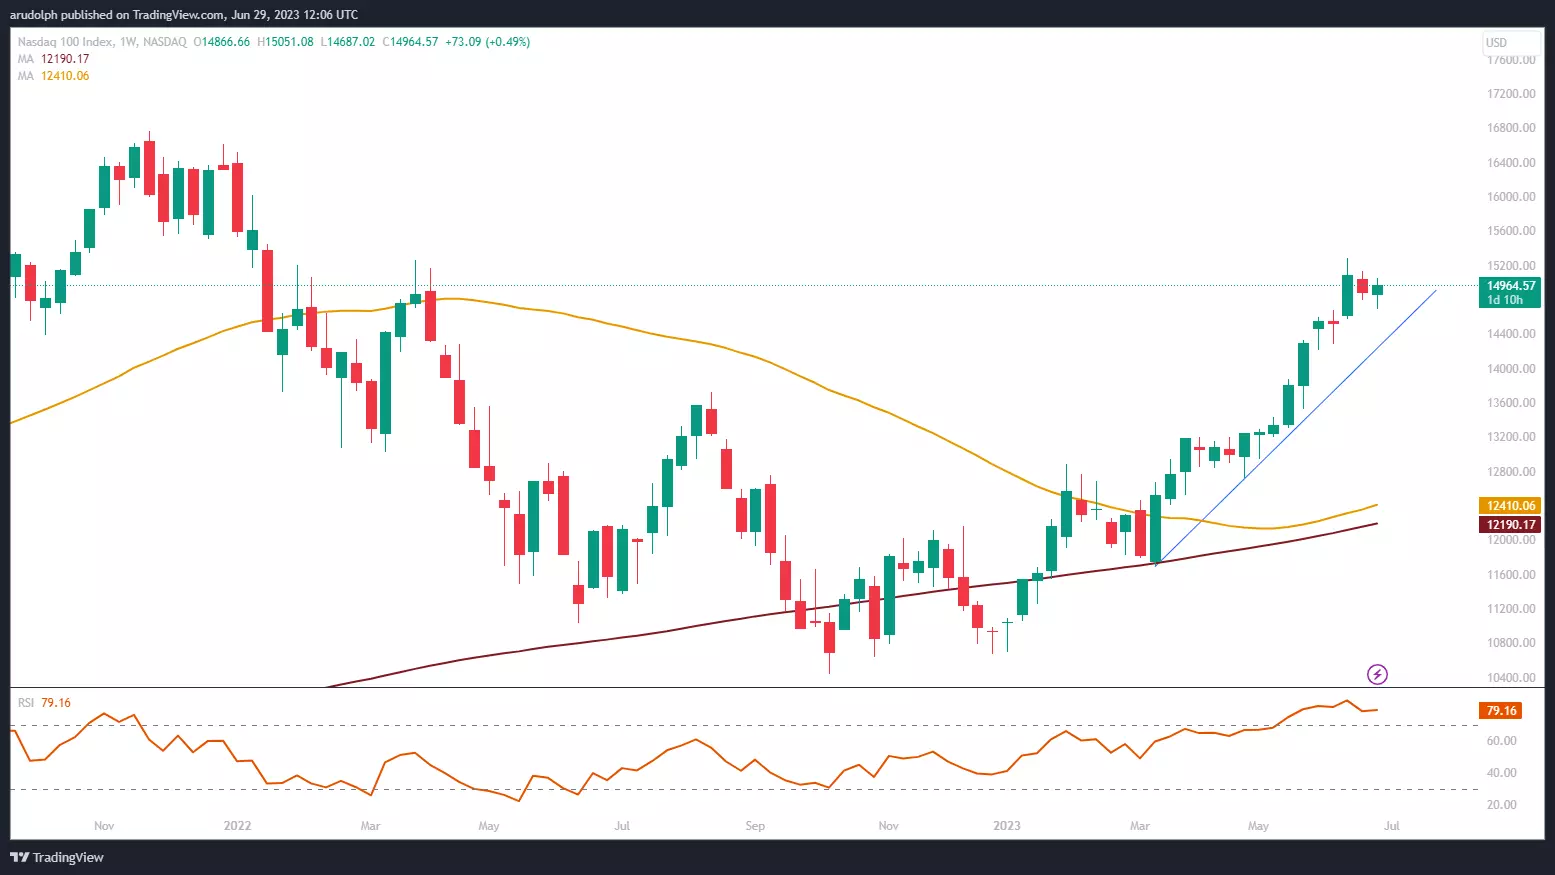
There we can also spot a Harami for last week’s trading but this has been broken to the downside this week, even if a recovery has since been seen. This means that while the current June high at 15,284.65 isn’t exceeded, a top may be in the process of being formed.
With the weekly RSI being as overbought as it was back in November 2022, before the Nasdaq 100 dropped by around 37%, and with it having a couple of week’s ago stalled marginally above its March 2022 peak, the odds of another top being formed are getting increasingly greater.
Nasdaq 100 Weekly Candlestick Chart
Since the Nasdaq 100 Bullish Percent Index has given a sell signal last week at a time where the CNN Greed and Fear Index has stayed in “extreme greed” territory for the third week in a row and as the Chicago Board of Options Exchange (CBOE) volatility index (VIX) continues to slide and trades at pre-pandemic levels, the risks of a bearish reversal soon rearing its head are rapidly increasing.
All of these contrary indicators show how complacent investors are when it comes to adding to their long Nasdaq 100 positions or entering new ones at these current elevated levels ahead of the Fed’s preferred inflation measure, the PCE price index, released on Friday.
Or as nineteenth century novelist Victor Hugo said “caution is the eldest child of wisdom.”
This information has been prepared by IG, a trading name of IG Markets Limited. In addition to the disclaimer below, the material on this page does not contain a record of our trading prices, or an offer of, or solicitation for, a transaction in any financial instrument. IG accepts no responsibility for any use that may be made of these comments and for any consequences that result. No representation or warranty is given as to the accuracy or completeness of this information. Consequently any person acting on it does so entirely at their own risk. Any research provided does not have regard to the specific investment objectives, financial situation and needs of any specific person who may receive it. It has not been prepared in accordance with legal requirements designed to promote the independence of investment research and as such is considered to be a marketing communication. Although we are not specifically constrained from dealing ahead of our recommendations we do not seek to take advantage of them before they are provided to our clients.

Take a position on indices
Deal on the world’s major stock indices today.
- Trade the lowest Wall Street spreads on the market
- 1-point spread on the FTSE 100 and Germany 40
- The only provider to offer 24-hour pricing
Live prices on most popular markets
- Forex
- Shares
- Indices
