Gold, silver and oil prices drop on recession fears
The short-term outlook on gold, silver and oil is bearish as China is forced to re-introduce lockdowns due to new Covid-19 outbreaks and as global recession fears mount.

Gold slips to the $1,722 September 2021 low
Gold trades in ten-month lows and is fast approaching the September 2021 low at $1,722 per troy ounce around which it is expected to find support, at least in the short-term.
In line with several other commodities, gold is now trading well below the Russian invasion of Ukraine levels as the US dollar continues to surge to multi-decade highs on safe haven flows.
A drop and daily chart close below the $1,722 low would engage the August 2021 low at $1,684 and also the June 2020 and March 2021 lows at $1,678 to $1,671.
Minor resistance can now be found at the $1,753 to $1,754 last reaction high on the daily chart last Friday and the December 2021 trough.

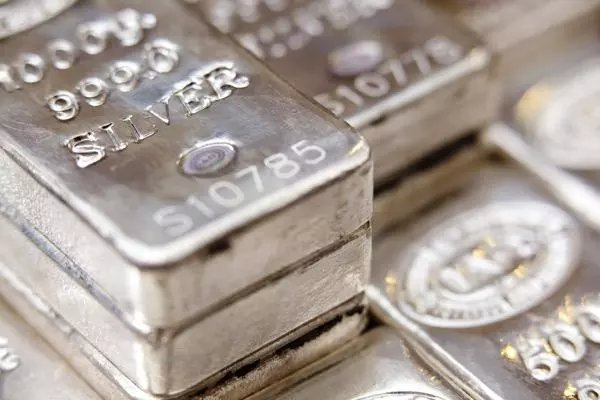
Silver weighs on major support at its February 2020 pre-pandemic high
The price of silver is in the process of falling for its seventh consecutive week with the February 2020 pre-pandemic high at $18.95 per troy ounce being revisited as the US dollar trades in multi-decade highs on safe haven flows. It represents key support.
If it were to give way, the next downside target for silver would be the 61.8% Fibonacci retracement of the 2020 to 2021 bull market and the June 2020 high at $18.48 to $18.39.
The 1 July low, together with the last reaction high on the daily chart – where a candle’s highest point is above that to its left and to its right – offer immediate resistance at $19.38 to $19.48 ahead of the minor psychological $20 mark.

WTI consolidates below resistance
West Texas Intermediate (WTI) crude oil’s sharp drop from its 5 July $109.65 per barrel high took it to last week’s low at $93.33, close to the 200-day simple moving average (SMA) at $93.18 and the March and April lows at $92.69 to $92.45, before recovering to last week’s high at $103.00.
It was the previous support line which became a resistance line and stalled the rise. Since then, oil has slipped again on fresh Covid-19 curbs in China and mounting worries of a global economic slowdown weighing on the commodity.
Yesterday’s low at $98.65 may be retested, below which major support remains to be seen at $93.18 to $92.45.
Minor resistance sits at the June low at $101.22, at last week’s $103.00 high. Further resistance comes along the breached uptrend line and 1 July low at $103.39 to $103.45.
A fall through and daily chart close below the $92.45 March low would mean that the price of WTI has left its March-to-July wide trading range and would probably push it lower towards the October 2021 high at $85.06.

This information has been prepared by IG, a trading name of IG Markets Limited. In addition to the disclaimer below, the material on this page does not contain a record of our trading prices, or an offer of, or solicitation for, a transaction in any financial instrument. IG accepts no responsibility for any use that may be made of these comments and for any consequences that result. No representation or warranty is given as to the accuracy or completeness of this information. Consequently any person acting on it does so entirely at their own risk. Any research provided does not have regard to the specific investment objectives, financial situation and needs of any specific person who may receive it. It has not been prepared in accordance with legal requirements designed to promote the independence of investment research and as such is considered to be a marketing communication. Although we are not specifically constrained from dealing ahead of our recommendations we do not seek to take advantage of them before they are provided to our clients.

Speculate on commodities
Trade commodity futures, as well as 27 commodity markets with no fixed expiries.
- Wide range of popular and niche metals, energies and softs
- Spreads from 0.3 pts on Spot Gold, 2 pts on Spot Silver and 2.8 pts on Oil
- View continuous charting, backdated for up to five years
Live prices on most popular markets
- Forex
- Shares
- Indices
