Aston Martin Lagonda shares hit reverse
Aston Martin Lagonda shares erase early gains despite its annual loss coming in smaller than market expectations. The company has also delayed its first battery EV.

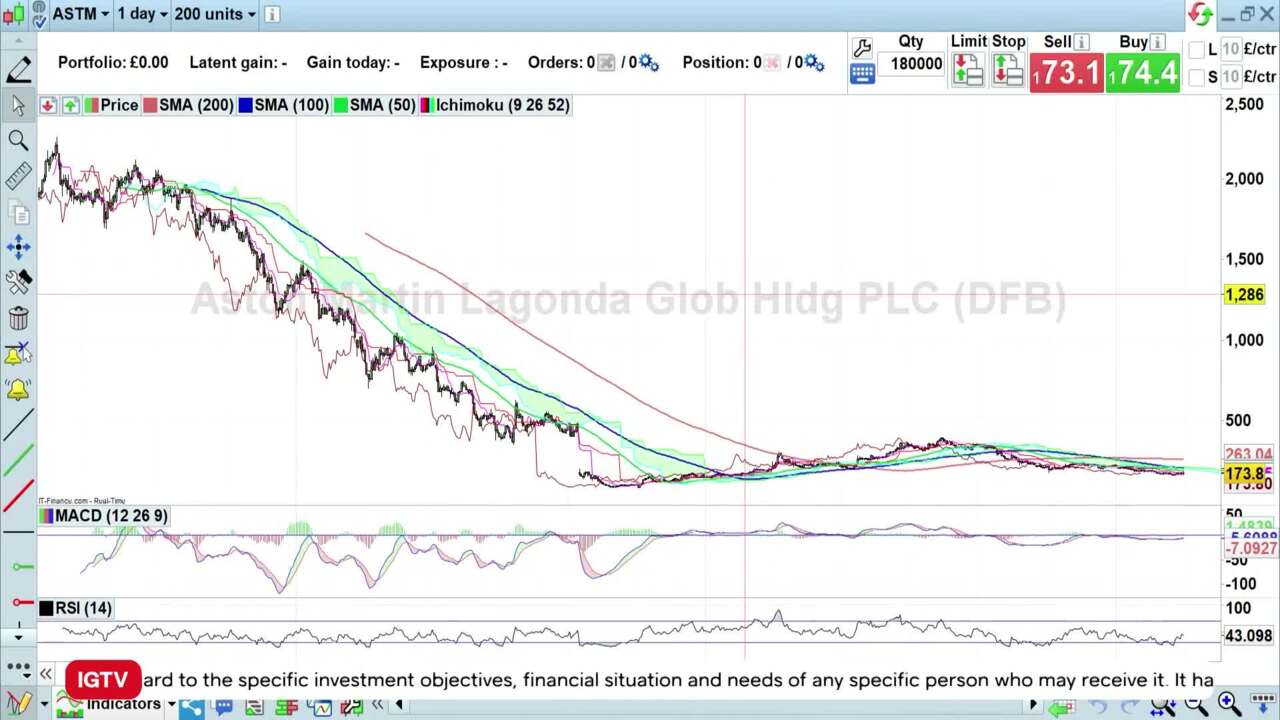

IGTV financial analyst Angeline Ong also looks at why the Ichimoku Cloud indicator on a daily chart suggests bearishness for the luxury car maker.
(AI Video Summary)
Aston Martin Lagonda's share price on the downside
Aston Martin Lagonda's shares have turned around and are currently up by 1.5%. However, the company's cash flow and sales in the fourth quarter did not meet investors' expectations, which has made them worried. Even though the company exceeded predictions for pre-tax loss, investors are more concerned about the lower-than-expected cash flow and sales.
Ichimoku Cloud chart analysis
Aston Martin has heavily invested in marketing to establish itself as a top-notch luxury race car brand in the leisure market. They have focused on promoting their Valkyrie models and special edition cars. However, an analysis of the Ichimoku Cloud chart shows that Aston Martin has faced significant challenges since it entered the market in 2018. Looking at the monthly chart, we can see that the stock is trading below the Cloud, which is not a good sign for the company. The weekly chart also confirms this observation, indicating that the stock is still below the cloud. To get a closer view of the current situation, the daily chart shows that Aston Martin's stock is down by 1.5%.
Overall, although Aston Martin's shares have improved slightly, concerns remain about the company's disappointing cash flow and sales. The analysis of the Ichimoku cloud chart suggests that Aston Martin has been facing difficulties since it entered the market in 2018.
This information has been prepared by IG, a trading name of IG Markets Limited. In addition to the disclaimer below, the material on this page does not contain a record of our trading prices, or an offer of, or solicitation for, a transaction in any financial instrument. IG accepts no responsibility for any use that may be made of these comments and for any consequences that result. No representation or warranty is given as to the accuracy or completeness of this information. Consequently any person acting on it does so entirely at their own risk. Any research provided does not have regard to the specific investment objectives, financial situation and needs of any specific person who may receive it. It has not been prepared in accordance with legal requirements designed to promote the independence of investment research and as such is considered to be a marketing communication. Although we are not specifically constrained from dealing ahead of our recommendations we do not seek to take advantage of them before they are provided to our clients.

Seize a share opportunity today
Go long or short on thousands of international stocks.
- Increase your market exposure with leverage
- Get spreads from just 0.1% on major global shares
- Trade CFDs straight into order books with direct market access
Live prices on most popular markets
- Forex
- Shares
- Indices
