Week ahead forecast Oct 16th -22nd: Nasdaq, Hang Seng and gold
The fast-changing geopolitical tensions in the Middle East are now being taken seriously, resulting in a significant surge in oil and gold prices since last Friday


The fast-changing geopolitical tensions in the Middle East are now being taken seriously, resulting in a significant surge in oil and gold prices since last Friday, by 5.5% and 4.5% respectively, while risk equities have suffered. What unfolds in the battlefield in the week ahead is poised to be the predominant catalyst for stirring up the market sentiment.
On the economic front, all eyes are set to focus on China this week as the world's second-largest economy is scheduled to unveil a pack of heavy-weight economic data, including Q3 GDP growth rate, industrial production, retail sales, and the unemployment rate. This upcoming release would be seen as a vital test of the prevailing view that China's economy may have weathered its worst.
Meanwhile, in the United States, the growing expectation from the previous week that the Federal Reserve is prepared to adopt a more dovish stance, following several speeches by key Fed members, will also face a reality check as the boss of the world's most influential central bank, Jerome Powell, takes the stage to deliver his address on the monetary outlook.
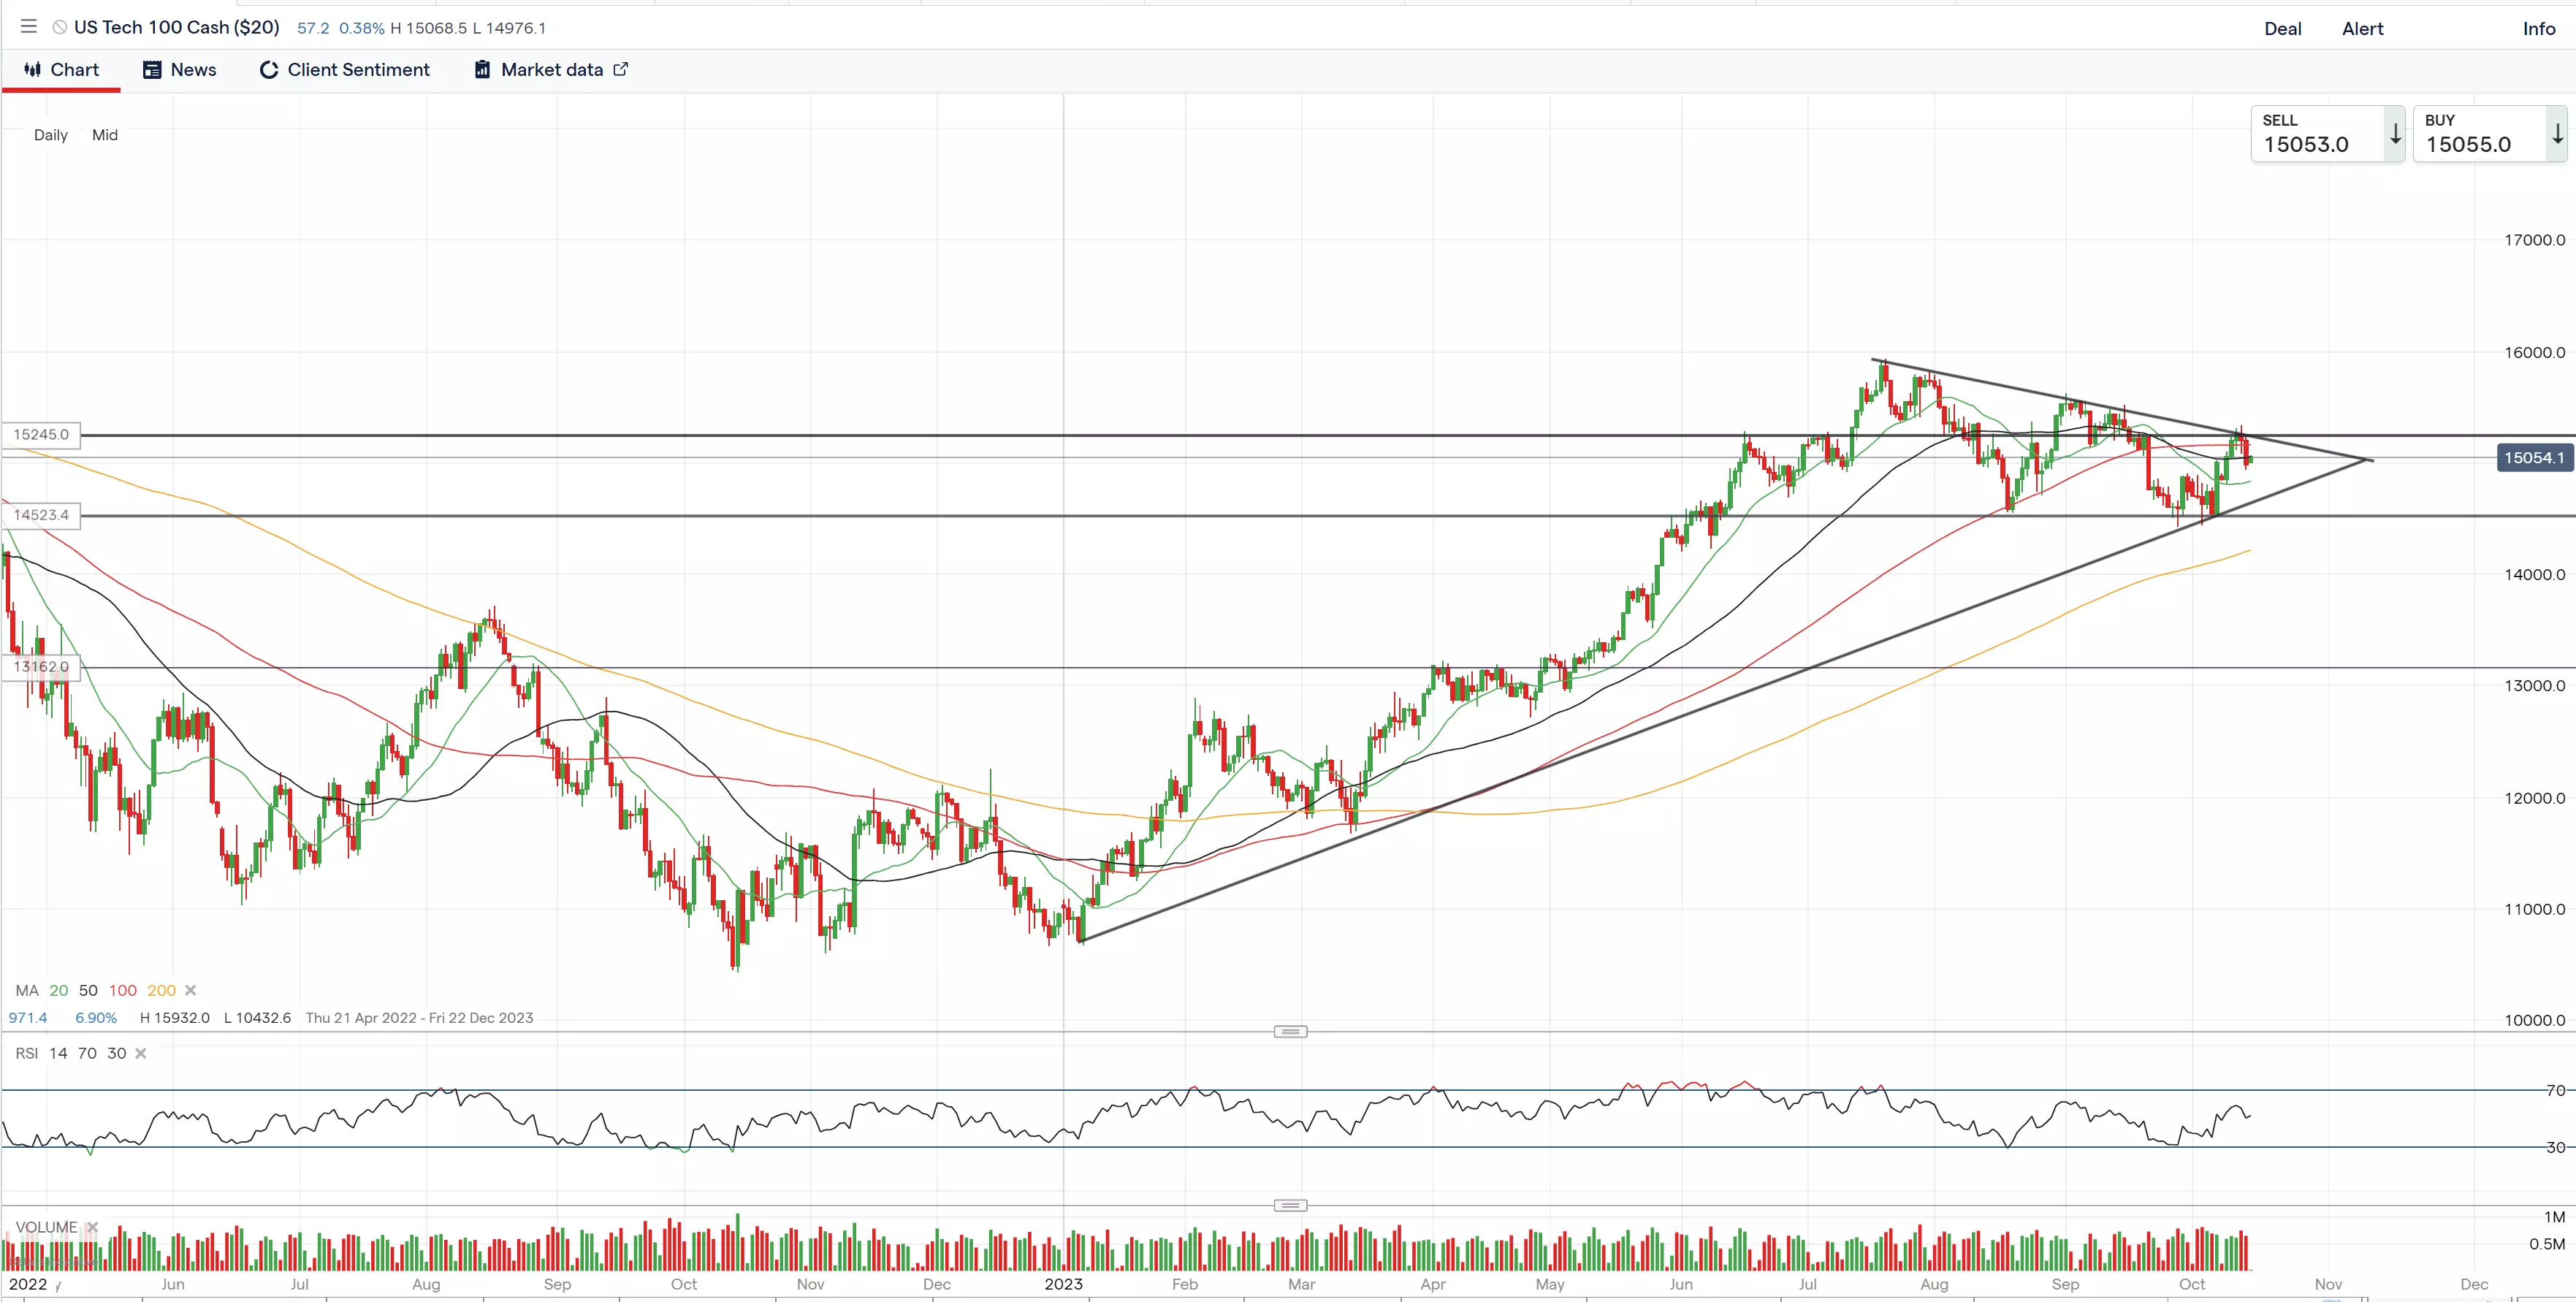
Nasdaq
The Nasdaq's three consecutive days of rebound in the past week came to an end due to a hotter-than-expected US CPI, resulting in a lower-high on the daily chart, which highlights weakening sentiment. This pullback has effectively pierced through both the 100-day and 50-day moving averages (MA), leaving the unbroken 20-day MA as the immediate support for now, near 14,829.
The ascending trendline connecting the lows from January and October will now be considered a critical support and milestone for bulls and bears. Provided it holds, the Nasdaq index still has a good chance to challenge the ceiling at 15,245 from a medium-term perspective. On the flip side, a further decline below 14,520 may trigger additional selling pressure.
Hang Seng Index:
Hong Kong's Hang Seng Index extended its loss at the beginning of the new week, following a disappointing inflation data from China. This decline pushed the market further away from the monthly high it reached last week and once again brought the price below the 18,000 threshold. Weakness was notably prominent in sectors such as property, industrial, consumer, and technology.
Looking ahead, the Hang Seng is expected to face a week filled with great volatilities. The release of China's economic data in the mid-week, especially the Q3 GDP growth rate, is poised to significantly impact the perception of China's recovery journey and its closely related market.
From a technical perspective, the Hang Seng Index has shifted lower after failing to overcome the resistance at 18105. This move has reaffirmed the broader downward trend, pulling the index closer to the descending trendline observed between August and October. Currently, the immediate support level stands at the August low of 17595, with the 11-month low of 17,170 coming into play should this support be breached.

Gold
The precious metal has successfully orchestrated a remarkable turnaround in the past week, rallying approximately 4.6% due to a surge in demand for safe-haven assets, ignited and fueled by escalating geopolitical tensions in the Middle East.
A clear breakout can be observed on the daily chart, with the price is now trading above both short and medium-term moving averages. The ceiling of the previous moving trajectory has transformed into a critical support level, standing above $1920.
In the near term, a technical barrier seems to be around $1,937, where the 200-day moving average is positioned. With further strength, we may witness the price heading towards $1,950, a level that has not been reached since August.

This information has been prepared by IG, a trading name of IG Limited. In addition to the disclaimer below, the material on this page does not contain a record of our trading prices, or an offer of, or solicitation for, a transaction in any financial instrument. IG accepts no responsibility for any use that may be made of these comments and for any consequences that result. No representation or warranty is given as to the accuracy or completeness of this information. Consequently any person acting on it does so entirely at their own risk. Any research provided does not have regard to the specific investment objectives, financial situation and needs of any specific person who may receive it. It has not been prepared in accordance with legal requirements designed to promote the independence of investment research and as such is considered to be a marketing communication. Although we are not specifically constrained from dealing ahead of our recommendations we do not seek to take advantage of them before they are provided to our clients.
CFDs are a leveraged products. CFD trading may not be suitable for everyone and can result in losses that exceed your initial deposit, so please ensure that you fully understand the risks involved.

Seize your opportunity
Deal on the world’s stock indices today.
- Trade on rising or falling markets
- Get one-point spreads on the FTSE 100
- Unrivalled 24-hour pricing
See opportunity on an index?
Try a risk-free trade in your demo account, and see whether you’re on to something.
- Log in to your demo
- Try a risk-free trade
- See whether your hunch pays off
See opportunity on an index?
Don’t miss your chance – upgrade to a live account to take advantage.
- Get spreads from one point on the FTSE 100
- Trade more 24-hour indices than any other provider
- Analyse and deal seamlessly on smart, fast charts
See opportunity on an index?
Don’t miss your chance. Log in to take your position.
Live prices on most popular markets
- Forex
- Shares
- Indices
Prices above are subject to our website terms and agreements. Prices are indicative only. All shares prices are delayed by at least 15 mins.
