US indices attempt to stabilise, while China’s loan prime rates delivered more modest response: Nasdaq 100, Hang Seng Index, US dollar
Major US indices were subdued to end last Friday, but nevertheless, it reflected an attempt to stabilise following three straight days of heavy losses.


Market Recap
Major US indices were subdued to end last Friday (DJIA +0.07%; S&P 500 -0.01%; Nasdaq -0.20%), but nevertheless, it reflected an attempt to stabilise following three straight days of heavy losses. This comes as the VIX touches its highest level in nearly three months as a sign of prevailing market caution, but with the sharp paring of its gains on Friday potentially providing some solace in the near term.
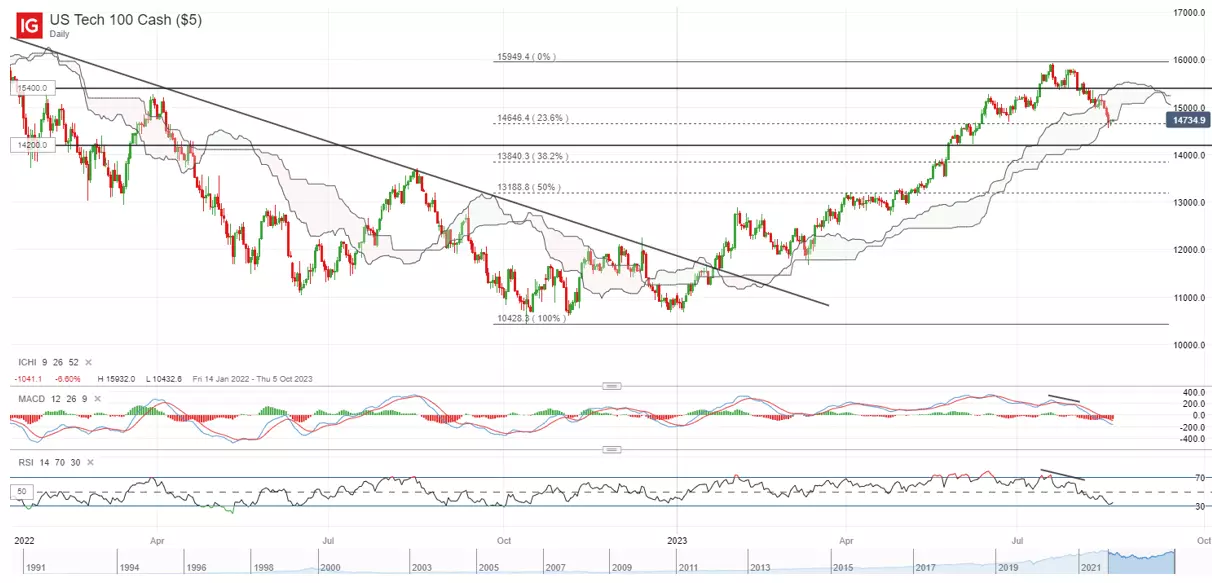
This week, movements in the US Treasury yields will remain on the radar to guide risk sentiments, with the two-year yields stuck in a consolidation over the past week while the 10-year and 30-year yields are both hovering just below their October 2022 peak. A fresh break to a new multi-year high may keep a high-for-longer rate outlook in place, which is likely to renew the selling pressure on risk assets, while a turn lower in bond yields could support some near-term relief. For now, all three US indices remain below their respective 50-day moving average (MA).
Perhaps one to watch may be the Nasdaq 100 index, which is retesting a near-term support confluence at the 14,600 level, where a 23.6% Fibonacci retracement stands if drawn from its October 2022 bottom to recent July 2023 peak. This also coincides with a Ichimoku cloud support zone on the daily chart. Any failure for the 14,600 level to hold this week may potentially pave the way to retest the 14,200 level next.
Asia Open
Asian stocks look set for a mixed open, with Nikkei+0.55%, ASX -0.26% and KOSPI +0.66% at the time of writing. Chinese equities continue to see some shunning, with the Nasdaq Golden Dragon China Index down 3.5% last Friday despite the more subdued showing in Wall Street. The Hang Seng Index has now registered a new year-to-date low, as risks in the property sector have not been met with a compelling response from authorities thus far. The preferences for more indirect support from authorities were once again reflected with further calls from the People's Bank of China (PBoC) and financial regulators for banks to increase lending, but whether it will be met with a significant increase in demand will still be a question.
Following the surprise 15 basis-point (bp) cut to its one-year medium-term lending facility (MLF) rate last week, broad expectations for a similar cut to both one-year and five-year loan prime rate today were met with disappointment. The one-year loan prime rate today was cut by 10 bp cut to 3.45%, while the five-year loan prime rate, which influences the pricing of home mortgages, was surprisingly kept unchanged. The more modest response has kept overall sentiments in Chinese equities in check, potentially with worries for the property sector risks to drag for longer and drive a low-for-longer economic growth story.
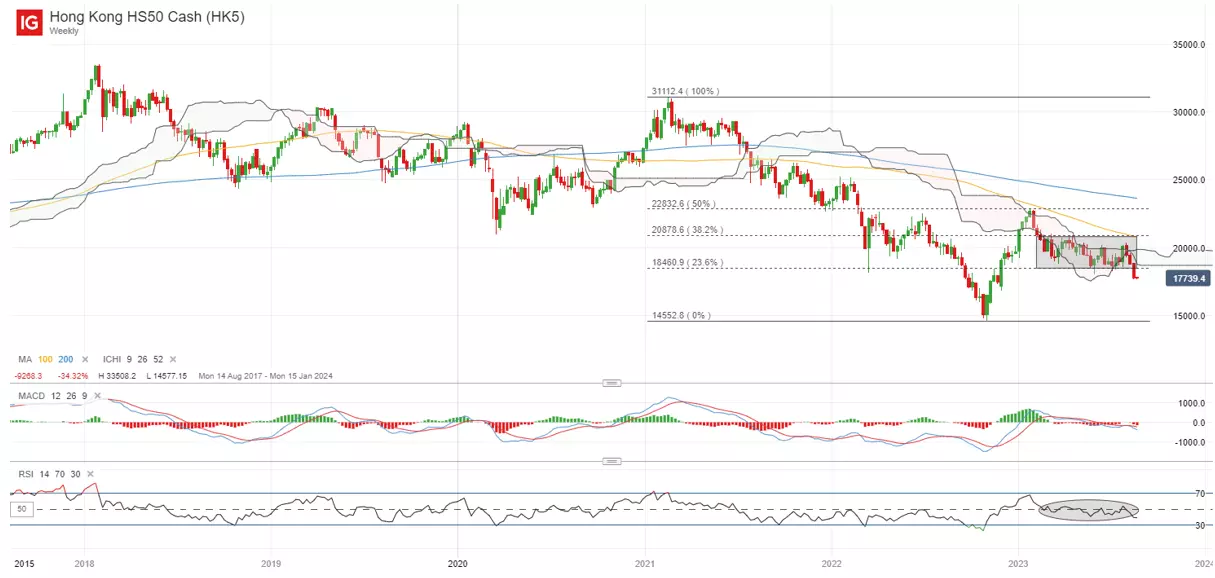
Having broken to a new lower low, it seems that sellers remain in control for the Hang Seng Index, with a 23.6% Fibonacci retracement level given way last week. That may place the 16,900 level on watch next. Greater conviction for the bulls may still have to come from a move back above its Ichimoku cloud resistance on the weekly chart around the key psychological 20,000 level.
On the watchlist: US dollar consolidating at key resistance
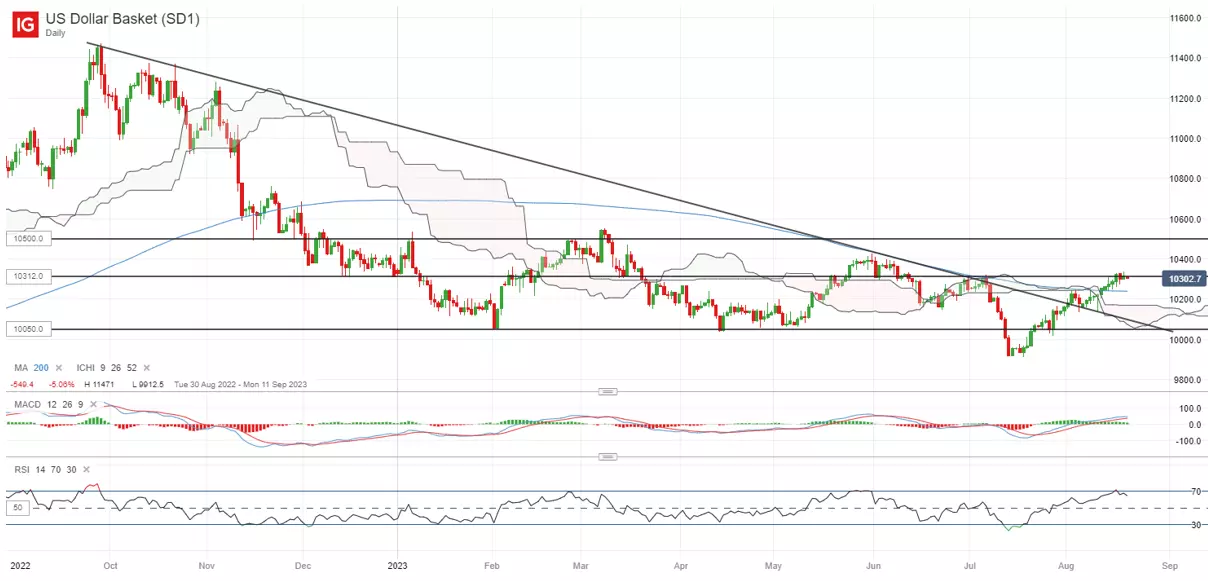
Similar to the point of reckoning for US Treasury yields ahead, the US dollar is also consolidating around a key resistance at the 103.12 level, where it failed to overcome back in June and July this year. Its relative strength index (RSI) on the weekly chart is also hovering at its key 50 level, where it has failed to get over since November last year. Failure to move past the 50 level could still leave sellers in greater control, which keeps the broader downward trend in place. For now, any turn lower in the US dollar could leave the 102.30 level on watch, while on the other hand, breaking past the 103.12 level of resistance could potentially pave the way to retest the 105.00 level.
Friday: DJIA +0.07%; S&P 500 -0.01%; Nasdaq -0.20%, DAX -0.65%, FTSE -0.65%
IGA, may distribute information/research produced by its respective foreign affiliates within the IG Group of companies pursuant to an arrangement under Regulation 32C of the Financial Advisers Regulations. Where the research is distributed in Singapore to a person who is not an Accredited Investor, Expert Investor or an Institutional Investor, IGA accepts legal responsibility for the contents of the report to such persons only to the extent required by law. Singapore recipients should contact IGA at 6390 5118 for matters arising from, or in connection with the information distributed.
The information/research herein is prepared by IG Asia Pte Ltd (IGA) and its foreign affiliated companies (collectively known as the IG Group) and is intended for general circulation only. It does not take into account the specific investment objectives, financial situation, or particular needs of any particular person. You should take into account your specific investment objectives, financial situation, and particular needs before making a commitment to trade, including seeking advice from an independent financial adviser regarding the suitability of the investment, under a separate engagement, as you deem fit.
No representation or warranty is given as to the accuracy or completeness of this information. Consequently, any person acting on it does so entirely at their own risk. Please see important Research Disclaimer.
Please also note that the information does not contain a record of our trading prices, or an offer of, or solicitation for, a transaction in any financial instrument. Any views and opinions expressed may be changed without an update.

Seize a share opportunity today
Go long or short on thousands of international stocks.
- Increase your market exposure with leverage
- Get spreads from just 0.1% on major global shares
- Trade CFDs straight into order books with direct market access
Live prices on most popular markets
- Forex
- Shares
- Indices
See more forex live prices
See more shares live prices
Prices above are subject to our website terms and agreements. Prices are indicative only. All shares prices are delayed by at least 15 mins.
See more indices live prices
Prices above are subject to our website terms and agreements. Prices are indicative only. All shares prices are delayed by at least 20 mins.
