Subdued start to seasonally weaker month of May: Nasdaq 100, AUD/USD, Gold
Lesser-than-expected contraction in the US ISM manufacturing PMI translates to some firming in the US dollar ahead of the FOMC meeting this week.

Market Recap
Lesser-than-expected contraction in the US ISM manufacturing Purchasing Managers Index (PMI) (47.1 versus 46.8) translates to some firming in the US dollar ahead of the Federal Open Market Committee (FOMC) meeting this week, as rate expectations reacted to more resilient economic data with some slight hawkish recalibration. A rate pause after the May meeting is still the broad consensus but higher manufacturer prices (53.2 versus 49 forecast) and resilient manufacturing employment (50.2 versus 46.9 forecast) may suggest less room for the Federal Reserve (Fed) to step down from its tightening stance over subsequent meetings if pricing pressures persist.
Treasury yields were lifted higher as a result, with the two-year and ten-year up 13 basis-points, keeping a lid for gold and silver’s upside overall. JPMorgan’s purchase for most of First Republic’s assets may aid to provide some calm and prevent a deeper sell-off in the overall financial sector, but the continued downbeat performance in US regional banks suggests that reservations for lingering contagion risks remain.
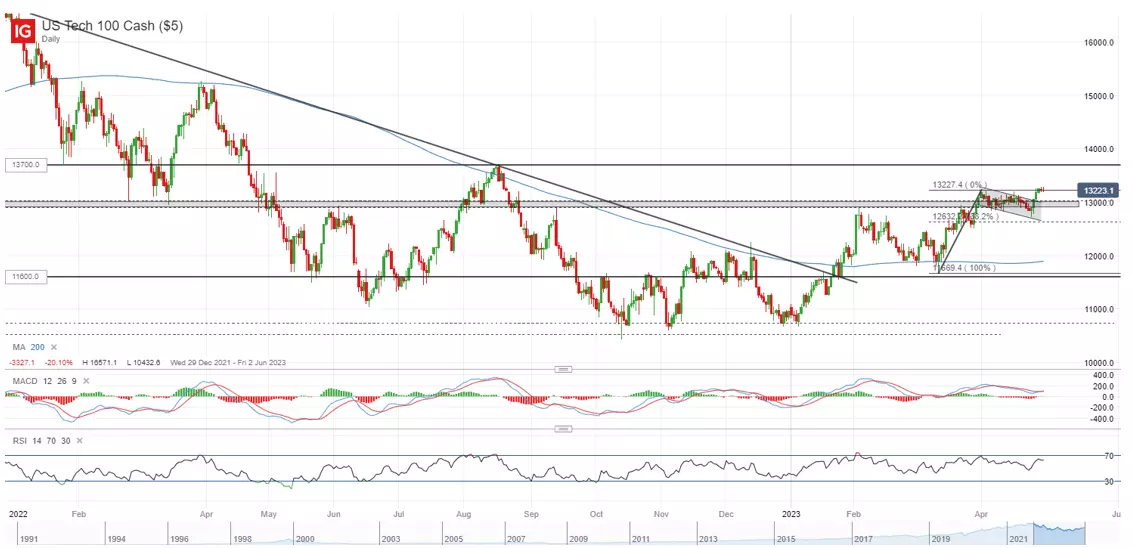
Overall, that brought a more subdued start to the seasonally-weaker month of May for major US indices (DJIA -0.14%; S&P 500 -0.04%; Nasdaq -0.11%). However, the upward trend in the Nasdaq 100 remains intact, with the index validating its bullish flag pattern with a 3% upmove last week. This may leave the 13,700 level on watch next.
Asia Open
Asian stocks look set for a mixed open, with Nikkei -0.04%, ASX -0.22% and KOSPI +0.54% at the time of writing. Continued decline in South Korea’s inflation (3.7% versus 3.75% forecast) brought further validation that its rate hiking cycle is likely over, which provides a boost for the KOSPI. Elsewhere, risk sentiments took a breather, following recent rallies to end last week.
Focus will be on the Reserve Bank of Australia’s (RBA’s) decision today, with broad expectations for rates to be on hold at 3.60%. Recent moderation in trimmed-mean inflation provides room for some wait-and-see from the central bank but any forward guidance will be on watch as well. The release of previous RBA minutes suggests that the rate pause has been a close call, with current market pricing reflecting some expectations that an additional rate hike could still be warranted over coming months. All eyes will be on any signs of softening from previous hawkish tone.
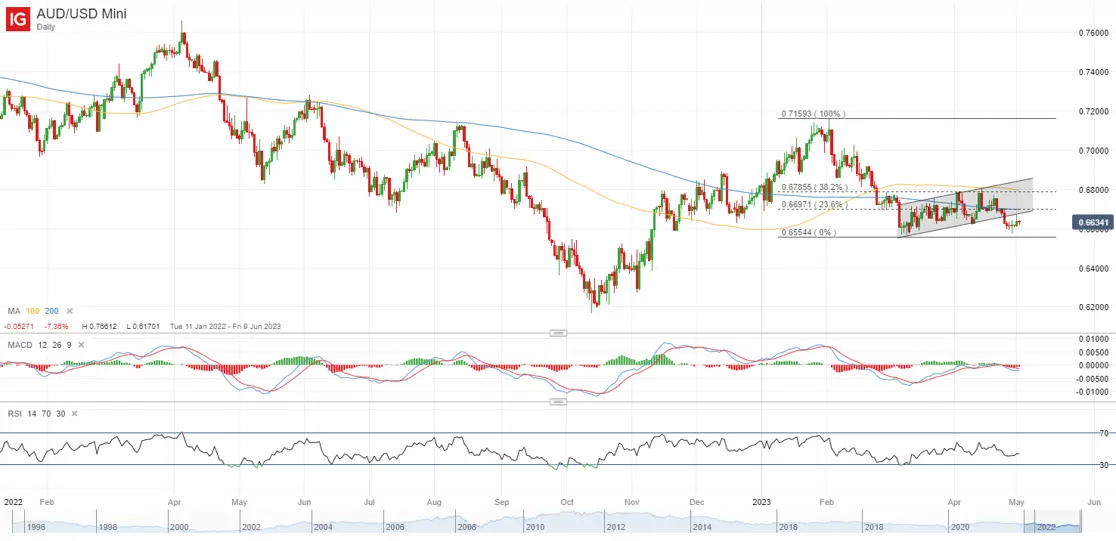
Following a breakdown of a channel trendline support, moves in the AUD/USD remain lacklustre as the pair hangs near its 2023 low. A hawkish takeaway from the upcoming RBA meeting could provide a near-term uplift for the pair but a series of resistance still lies ahead for the pair to overcome. Greater conviction for a renewed upward trend could have to come from a move back above its 200-day and 100-day moving averages (MA).
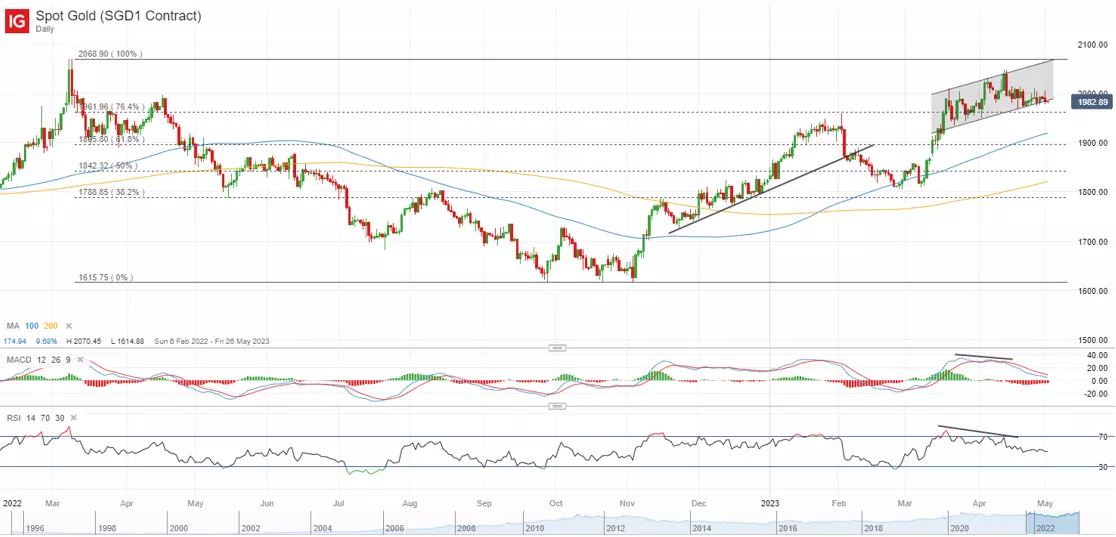
On the watchlist: Gold prices still struggling to bounce off lower channel trendline
Intermittent attempts for gold prices to bounce off the lower channel trendline support has failed to find much follow-through thus far, as renewed upmove in Treasury yields and the US dollar kept sellers in place to prevent a move back above the key US$2,000 level. The US$2,000 level will remain a key level to overcome in order to suggest buyers back in control. Meanwhile, moderating upward momentum has been reflected with declining moving average convergence/divergence (MACD) and Relative Strength Index (RSI), with any breakdown of the US$1,960 level potentially paving the way towards the US$1,895 level next.
Monday: DJIA -0.14%; S&P 500 -0.04%; Nasdaq -0.11%, DAX +0.77%, FTSE +0.50%
IGA, may distribute information/research produced by its respective foreign affiliates within the IG Group of companies pursuant to an arrangement under Regulation 32C of the Financial Advisers Regulations. Where the research is distributed in Singapore to a person who is not an Accredited Investor, Expert Investor or an Institutional Investor, IGA accepts legal responsibility for the contents of the report to such persons only to the extent required by law. Singapore recipients should contact IGA at 6390 5118 for matters arising from, or in connection with the information distributed.
The information/research herein is prepared by IG Asia Pte Ltd (IGA) and its foreign affiliated companies (collectively known as the IG Group) and is intended for general circulation only. It does not take into account the specific investment objectives, financial situation, or particular needs of any particular person. You should take into account your specific investment objectives, financial situation, and particular needs before making a commitment to trade, including seeking advice from an independent financial adviser regarding the suitability of the investment, under a separate engagement, as you deem fit.
No representation or warranty is given as to the accuracy or completeness of this information. Consequently, any person acting on it does so entirely at their own risk. Please see important Research Disclaimer.
Please also note that the information does not contain a record of our trading prices, or an offer of, or solicitation for, a transaction in any financial instrument. Any views and opinions expressed may be changed without an update.

Seize a share opportunity today
Go long or short on thousands of international stocks.
- Increase your market exposure with leverage
- Get spreads from just 0.1% on major global shares
- Trade CFDs straight into order books with direct market access
Live prices on most popular markets
- Forex
- Shares
- Indices
See more forex live prices
See more shares live prices
Prices above are subject to our website terms and agreements. Prices are indicative only. All shares prices are delayed by at least 15 mins.
See more indices live prices
Prices above are subject to our website terms and agreements. Prices are indicative only. All shares prices are delayed by at least 20 mins.
