Stall in US debt ceiling talks prompts de-risking: Russell 2000, USD/SGD, NZD/JPY
The lack of any significant progress in the US debt ceiling negotiations just yet has translated to a de-risking process in Wall Street overnight.


Market Recap
The lack of any significant progress in the US debt ceiling negotiations just yet has translated to a de-risking process in Wall Street overnight (DJIA -0.69%; S&P 500 -1.12%; Nasdaq -1.26%), with expectations seemingly pricing that a gridlock could last for longer. The absence of any signs of progress will likely keep a cautious lid on market sentiments for now, with the VIX jumping 8% overnight, but the sharp moderation in US one-year credit default swaps (CDS) lately still reflects some optimism of an eventual resolution.
After rate expectations found a firm anchor for a Federal Reserve’s (Fed) rate pause in June just at the start of the week, expectations were shaken once more by hawkish Fedspeak and a stronger-than-expected flash Purchasing Managers' Index (PMI) reading (54.5 versus 50 forecast). That allowed the US Dollar to find its way higher (+0.2%) and is back to retest the key 103.12 level of resistance, where the upper edge of its Ichimoku cloud stands. Moving past this level could pave the way to retest the 105.00 level next.
This comes despite lower Treasury yields amid the cautious tone in the risk environment. Gold prices have managed to pare back earlier losses with safe-haven flows supporting some dip-buying, but continues to trade around its previous support-turned-resistance at the US$1,970 level. The yellow metal could continue to trade in a near-term ranging pattern, with clear signs of reversal not presented yet.
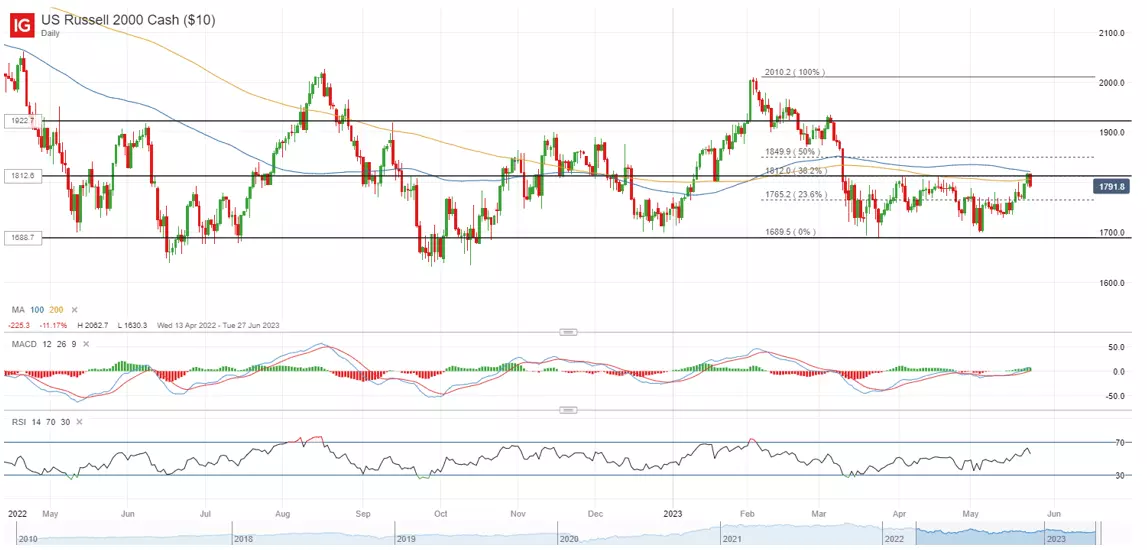
Perhaps one to watch will be the Russell 2000, where overnight losses (-0.3%) pale in comparison to other major indices. The index is back to retest its two-month high, with the formation of a double-bottom pattern in place. A series of resistance still stand in the way for now (double-bottom neckline, 100-day and 200-day moving average resistance), but if that could be overcome subsequently, it may pave the way to retest the 1,920 level next. Increasing Moving Average Convergence/Divergence (MACD) above the zero line aid to provide some support for the technical bulls for now, along with improving market breadth for greater upside participation.
Asia Open
Asian stocks look set for a negative open, with Nikkei -1.04%, ASX -0.42% and KOSPI -0.15% at the time of writing, following the negative handover from Wall Street. After hitting overbought technical conditions for the Nikkei 225, it seems that the index is finally seeing some unwinding. The weekly close may be important, considering a close near the lows this week may form a bearish shooting star candle for the index, which raises the risks of further downside. A stronger support may be at the key 30,000 psychological level for any formation of a higher low.
Chinese equities are facing the downward pressure as well, with the Hang Seng Index trading back below its 200-day moving average (MA). The economic surprise index for China continues to moderate to its lowest level since the start of the year, unwinding all the positive surprises with reopening. The lack of positive catalysts seems to drive some shunning for now, with faltering economic data and lingering geopolitical risks painting a potentially low-for-longer picture.
On another front, Singapore’s inflation release yesterday came with an upside surprise, which at first glance, may seek to challenge the Monetary Authority of Singapore’s (MAS) recent move to pause its tightening process. Core inflation came in at 5% versus 4.7% forecast. That said, the MAS expects pricing pressures to slow more discernibly in second half (2H) 2023, so much more data is needed to justify a restart in tightening. Initial gains in the SGD yesterday were quickly pared back.
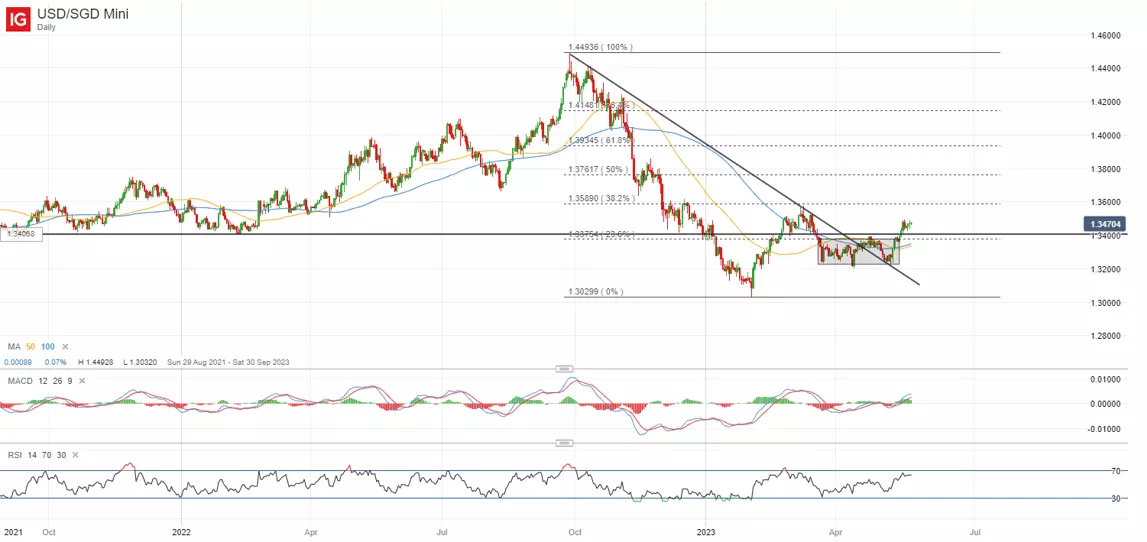
For the USD/SGD, a break above a ranging pattern last week seems to place its March 2023 high in sight at the 1.358 level, with the pair likely to take its cue from US dollar with the central focus around the US debt ceiling. For now, it could still seem to be a consolidation move within the broader downtrend.
On the watchlist: NZD/JPY retesting upper resistance range ahead of RBNZ meeting
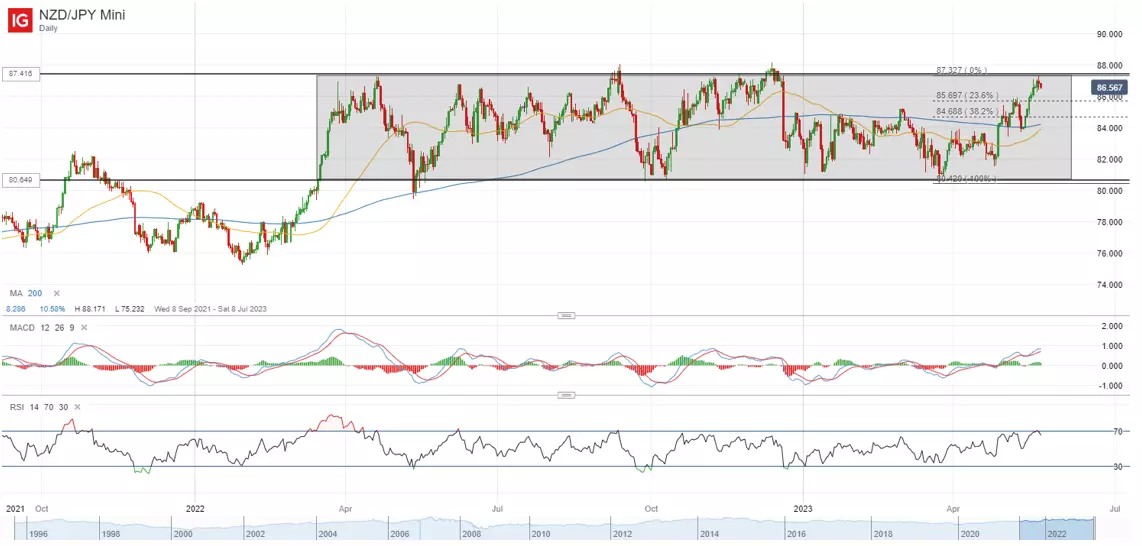
Having traded within a longer-term ranging pattern since March 2022, the NZD/JPY is back to retest near the upper resistance range at the 87.40 level ahead of the Reserve Bank of New Zealand (RBNZ) meeting. The upcoming meeting will likely be a close call, with expectations evenly split between the need for a 25 basis-point or a 50 basis-point move in its official cash rate (OCR), considering that an expansionary budget set-up and still-elevated inflation (6.7% in Q1) suggests that more needs to be done.
Guidance from policymakers about the peak rate will be key as well, with market pricing suggesting that it will be at 6%, so in the event of a dovish hike, we could still see NZD lower. For the NZD/JPY, this comes at a time, where a continued gridlock in US debt ceiling talks is supporting safe-haven flows for the JPY.
For now, a bearish divergence on MACD and Relative Strength Index (RSI) was formed on its four-hour chart, which suggests moderating upward momentum in the near term. A crucial line of support could come from its 200-day MA, which has seen the bulls defending the line on two occasions this month. That may leave the 84.68 level on watch for any formation of a higher low in the event of further retracement.
Tuesday: DJIA -0.69%; S&P 500 -1.12%; Nasdaq -1.26%, DAX -0.44%, FTSE -0.10%
IGA, may distribute information/research produced by its respective foreign affiliates within the IG Group of companies pursuant to an arrangement under Regulation 32C of the Financial Advisers Regulations. Where the research is distributed in Singapore to a person who is not an Accredited Investor, Expert Investor or an Institutional Investor, IGA accepts legal responsibility for the contents of the report to such persons only to the extent required by law. Singapore recipients should contact IGA at 6390 5118 for matters arising from, or in connection with the information distributed.
The information/research herein is prepared by IG Asia Pte Ltd (IGA) and its foreign affiliated companies (collectively known as the IG Group) and is intended for general circulation only. It does not take into account the specific investment objectives, financial situation, or particular needs of any particular person. You should take into account your specific investment objectives, financial situation, and particular needs before making a commitment to trade, including seeking advice from an independent financial adviser regarding the suitability of the investment, under a separate engagement, as you deem fit.
No representation or warranty is given as to the accuracy or completeness of this information. Consequently, any person acting on it does so entirely at their own risk. Please see important Research Disclaimer.
Please also note that the information does not contain a record of our trading prices, or an offer of, or solicitation for, a transaction in any financial instrument. Any views and opinions expressed may be changed without an update.

Seize a share opportunity today
Go long or short on thousands of international stocks.
- Increase your market exposure with leverage
- Get spreads from just 0.1% on major global shares
- Trade CFDs straight into order books with direct market access
Live prices on most popular markets
- Forex
- Shares
- Indices
See more forex live prices
See more shares live prices
Prices above are subject to our website terms and agreements. Prices are indicative only. All shares prices are delayed by at least 15 mins.
See more indices live prices
Prices above are subject to our website terms and agreements. Prices are indicative only. All shares prices are delayed by at least 20 mins.
