Risk mood improves as US bond yields, US dollar take a breather: Russell 2000, USD/JPY, GBP/USD
Wall Street gained for the second straight day, as US Treasury yields took a breather after touching their recent highs.


Market Recap
Wall Street gained for the second straight day (DJIA +0.62%; S&P 500 +0.63%; Nasdaq +0.84%), as US Treasury yields took a breather despite a hawkish takeaway from the Jackson Hole Symposium. Both the US 2-year and 10-year yields cooled by around 5 basis-point (bp) overnight after touching their recent highs. The VIX has also hit its two-week low, potentially as hedging bets unwind from greater clarity on the Federal Reserve (Fed)'s policy outlook. Amid the quiet economic calendar to start the week, market focus will now turn to a series of macro data ahead to justify whether a November rate hike from the Fed is warranted.
Today’s schedule will leave Germany and US consumer confidence data on watch, along with the US Job Openings and Labor Turnover Survey (JOLTS), where further moderation in US July job opening numbers is expected (9.465 million forecast versus 9.582 million prior). The US S&P/Case-Shiller home price index will be in focus as well, with US home prices expected to mark its fourth straight month of year-on-year decline (-1.3% forecast versus -1.7% prior).
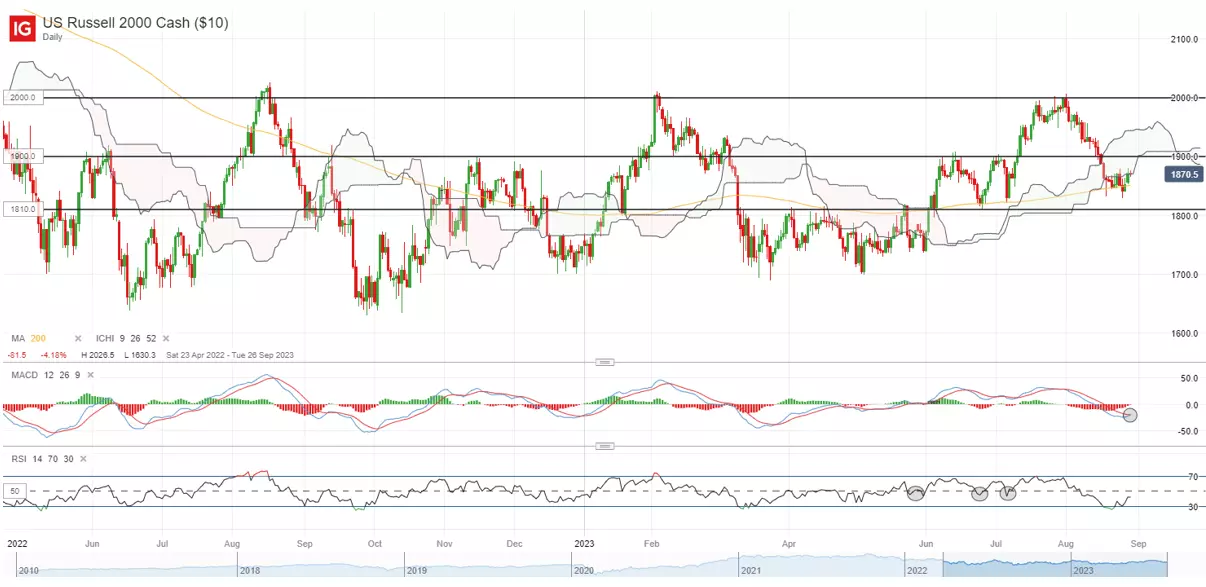
Perhaps one to watch may be the Russell 2000, which has been attempting to defend its 200-day moving average (MA) over the past week. Further upside may validate a bullish crossover on its moving average convergence/divergence (MACD) on the daily chart, with immediate resistance to overcome at the 1,900 level. On the broader scale, the index remains stuck in a long-ranging pattern since April 2022, with any move above the 1,900 level potentially leaving its upper bound at the key psychological 2,000 level on watch for a retest next.
Asia Open
Asian stocks look set for a positive open, with Nikkei +0.50%, ASX +0.45% and KOSPI +0.34% at the time of writing. Lower Treasury yields, a slightly weaker US dollar and the positive handover from Wall Street provide room for some relief in the region, despite lingering reservations surrounding Chinese equities.
Beijing’s latest efforts to boost markets has been met with a lukewarm reaction, with gains in Chinese equities fizzling into the close yesterday. The Hang Seng Index was up as much as 3% at one point, but closed only 0.9% higher. Similar measure in 2008 eventually saw the CSI 300 move to form a new low, suggesting that a turnaround in economic conditions remains the key driving force for longer-term upside in Chinese equities.
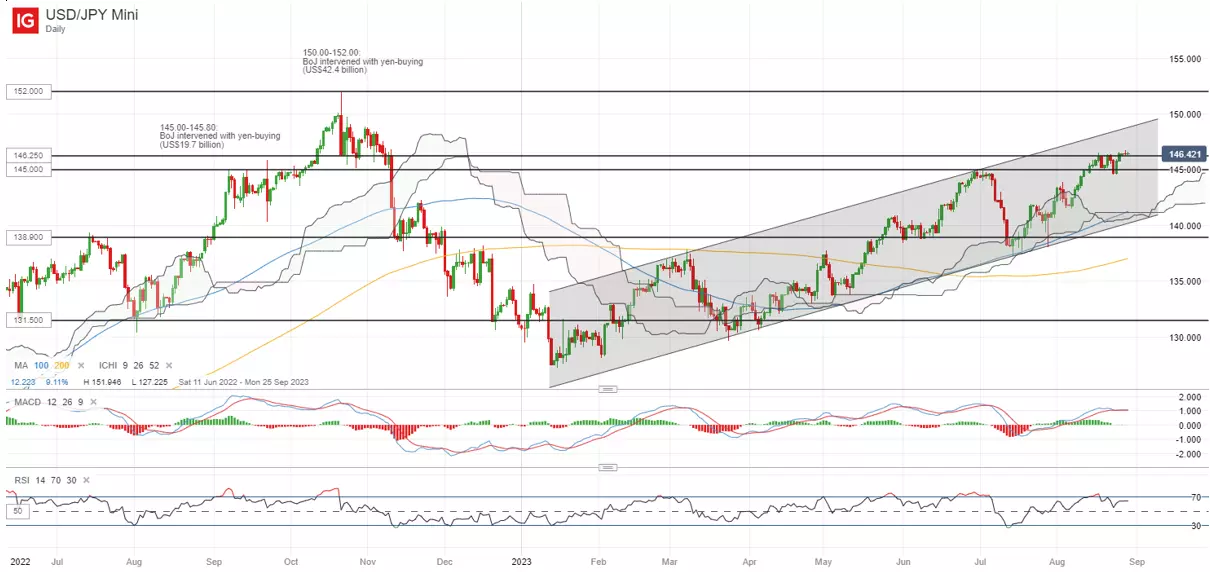
This morning saw Japan’s July unemployment rate head higher to 2.7% from previous 2.5% (forecast 2.5%), with the sharper moderation in Japan’s labour market likely to provide more room for dovishness for the Bank of Japan (BoJ) by having a taming effect on wage pressures. For now, the USD/JPY has breached the 145.00-145.80 level, where previous yen-buying intervention was executed back in September 2022. While the overall trend remains up with a rising channel pattern in place, some near-term exhaustion seems to be in place, with a flat-lined MACD and lower highs on its relative strength index (RSI) from the daily chart. The 145.00 level will be an immediate support to hold, failing which may pave the way to retest the 141.60 level next.
On the watchlist: GBP/USD retesting neckline of head-and-shoulder formation
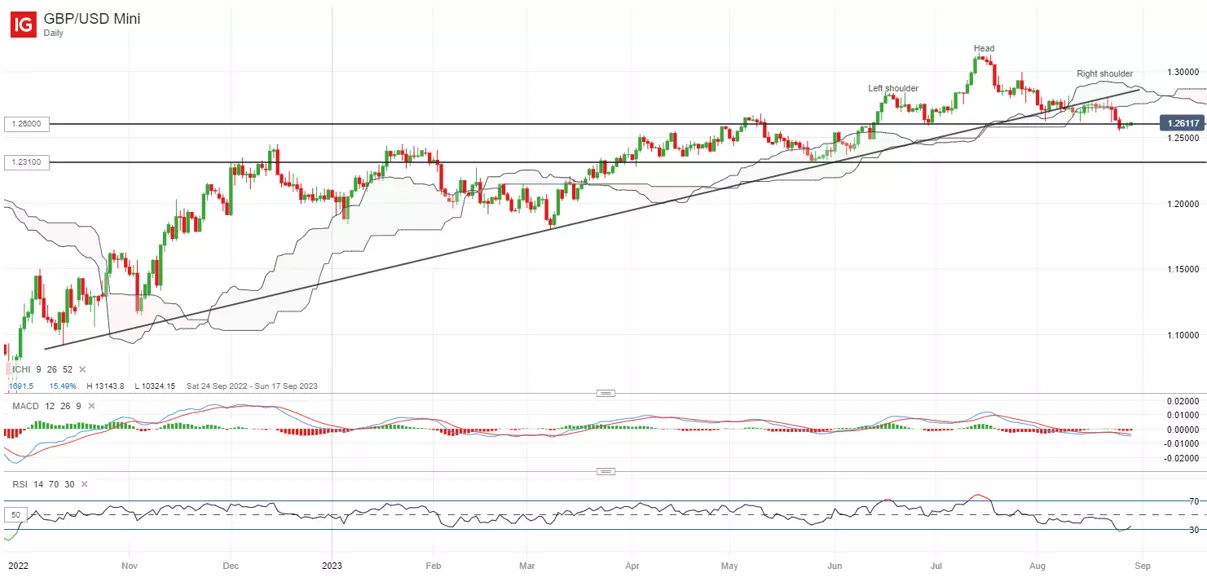
The GBP/USD has retraced by close to 4.5% since mid-July this year, further weighed by weaker-than-expected purchasing manager’s index (PMI) data out of the UK and some firming in the US dollar last week to retest its 1.260 level. On the broader scale, the 1.260 level seems to mark the neckline of a head-and-shoulder formation, with an attempt to stabilise after recent sell-off. Its weekly RSI continues to trade above the 50 level for now, which could still put an upward trend in place, but any failure to defend the 1.260 level over the coming days may potentially pave the way to retest the 1.231 level next.
Monday: DJIA +0.62%; S&P 500 +0.63%; Nasdaq +0.84%, DAX +1.03%, FTSE +0.07%
IGA, may distribute information/research produced by its respective foreign affiliates within the IG Group of companies pursuant to an arrangement under Regulation 32C of the Financial Advisers Regulations. Where the research is distributed in Singapore to a person who is not an Accredited Investor, Expert Investor or an Institutional Investor, IGA accepts legal responsibility for the contents of the report to such persons only to the extent required by law. Singapore recipients should contact IGA at 6390 5118 for matters arising from, or in connection with the information distributed.
The information/research herein is prepared by IG Asia Pte Ltd (IGA) and its foreign affiliated companies (collectively known as the IG Group) and is intended for general circulation only. It does not take into account the specific investment objectives, financial situation, or particular needs of any particular person. You should take into account your specific investment objectives, financial situation, and particular needs before making a commitment to trade, including seeking advice from an independent financial adviser regarding the suitability of the investment, under a separate engagement, as you deem fit.
No representation or warranty is given as to the accuracy or completeness of this information. Consequently, any person acting on it does so entirely at their own risk. Please see important Research Disclaimer.
Please also note that the information does not contain a record of our trading prices, or an offer of, or solicitation for, a transaction in any financial instrument. Any views and opinions expressed may be changed without an update.

Seize a share opportunity today
Go long or short on thousands of international stocks.
- Increase your market exposure with leverage
- Get spreads from just 0.1% on major global shares
- Trade CFDs straight into order books with direct market access
Live prices on most popular markets
- Forex
- Shares
- Indices
See more forex live prices
See more shares live prices
Prices above are subject to our website terms and agreements. Prices are indicative only. All shares prices are delayed by at least 15 mins.
See more indices live prices
Prices above are subject to our website terms and agreements. Prices are indicative only. All shares prices are delayed by at least 20 mins.
