Market relief in Wall Street amid China’s jitters: Russell 2000, Straits Times Index, AUD/USD
Wall Street managed to start the week higher, tapping on some recovery in big tech and semiconductors to override earlier jitters around China’s property and financial sector risks.


Market Recap
Wall Street managed to start the week higher (DJIA +0.07%; S&P 500 +0.57%; Nasdaq +1.05%), tapping on some recovery in big tech and semiconductors to override earlier jitters around China’s property and financial sector risks. There was not much to note on the economic calendar overnight, with the relief potentially attributed to the positive view on Nvidia from Morgan Stanley, along with some attempt to stabilise after recent sell-off.
US Treasury yields continue its way higher, with the 10-year yields back at its year-to-date high around the 4.2% level. The two-year yields edged near its 5% level as well, largely a reflection for US rates to be kept high for longer. The US dollar index tapped on higher yields to gain 0.3%, but are now facing a crucial test of resistance at its 200-day moving average (MA), which it has not overcome since November 2022. Its weekly relative strength index (RSI) is hanging at its key 50 level as well, suggesting that its moves over the coming days may be critical in determining the trend ahead.
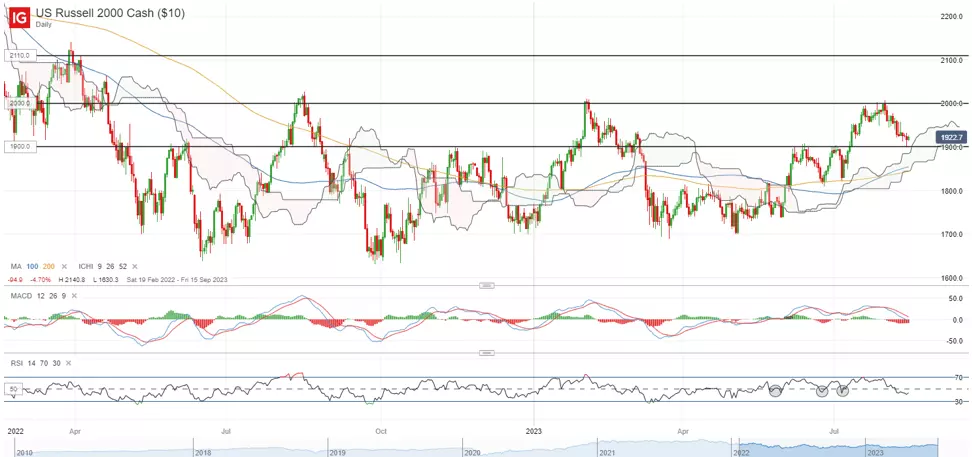
Perhaps one to watch may also be the Russell 2000 index , which is currently back at its previous horizontal resistance-turned-support at the 1,900 level, in coincidence with the upper edge of its Ichimoku cloud on the daily chart. A long-legged candle denotes some overnight dip-buying, but buyers may potentially find greater conviction from a move in the daily RSI back above its 50 level. For now, the 1,900 level will need to see some defending, failing which may pave the way towards the 1,820 level next.
Asia Open
Asian stocks look set for a positive open, with Nikkei +0.70% and ASX+0.38% at the time of writing. South Korean markets are off-trading for Liberation Day. Despite the relief in Wall Street, Chinese equities are more subdued, with the Nasdaq Golden Dragon China Index down 0.5% overnight.
Economic releases this morning saw a pull-ahead in Japan’s 2Q gross domestic product (GDP) (annualised 6% vs 3.1% forecast), the strongest expansion since 4Q 2020. The data is likely to provide the Bank of Japan (BoJ) with more room for normalisation, although the initial short-lived bounce in the Japanese yen seems to reflect some market expectations that patience from the central bank is still the likely stance.
Ahead, focus will be on the Reserve Bank of Australia (RBA) minutes. At the previous meeting, the RBA has kept its tightening bias in place for some policy flexibility, so the minutes will be scrutinised on the factors to guide the RBA’s next decision. The China’s monthly economic data dump will be in focus as well. Industrial production is expected to stay unchanged, while retail sales are projected to recover to 4.5% from previous 3.1%. The downside surprises in economic data lately may leave room for disappointment and it may still have to take a trend of recovering economic data to convince markets that the worst is over.
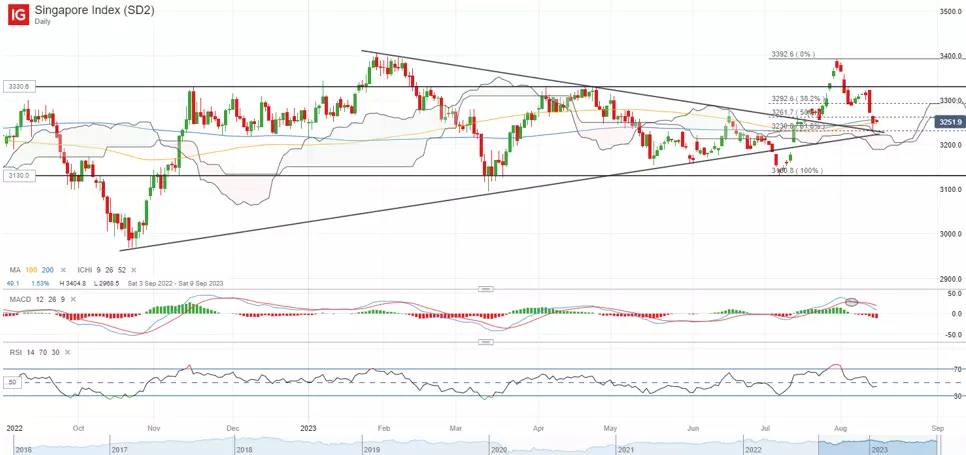
Closer to home, the Straits Times Index is attempting to defend its trendline support after unwinding all of its past month’s gains, alongside its 200-day MA at around the 3,245 level. Failure to defend the trendline support with a break below its 3,230 level may potentially support a move to retest its July 2023 bottom at the 3,130 level. On any upside, the 3,260 level will be an immediate resistance to overcome.
On the watchlist: AUD/USD attempting to find support from year-to-date low
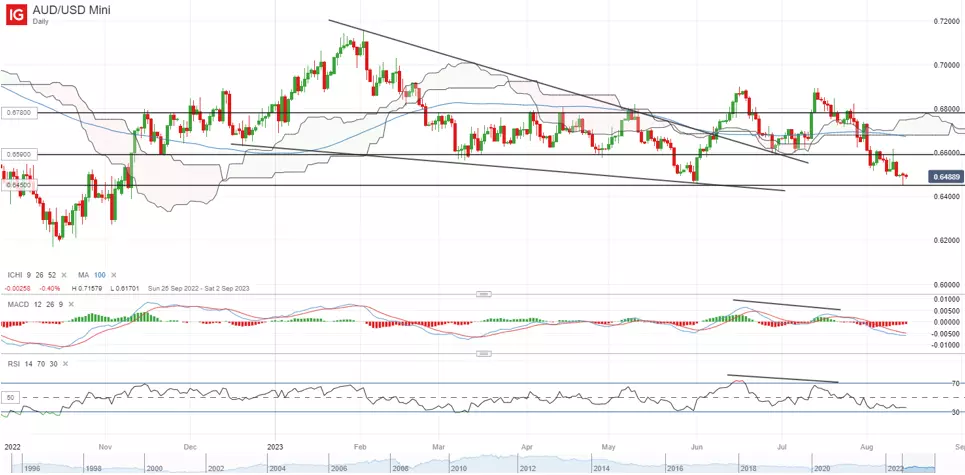
Ahead of the RBA meeting minutes and China’s economic data today, the AUD/USD is tapping on some relief in the risk environment overnight to hold its year-to-date bottom at the 0.645 level. The formation of a bullish pin bar on the daily chart reflects some near-term dip-buying, although one may watch for a confirmation close to potentially support a move to retest the 0.659 level.
Thus far, rate expectations remain firm that the RBA is nearing the end of its hiking cycle, but the central bank’s data-dependent stance will still leave eyes on incoming data such as wage growth and inflation for confirmation. For now, while there is an attempt to stabilise after recent sell-off, the broader trend still seems to carry a sideway to downward bias, with the weekly RSI hanging below the 50 level. The year-to-date bottom at the 0.645 level may have to see some defending ahead for some near-term relief.
Monday : DJIA +0.07%; S&P 500 +0.57%; Nasdaq +1.05%, DAX +0.46%, FTSE -0.23%
IGA, may distribute information/research produced by its respective foreign affiliates within the IG Group of companies pursuant to an arrangement under Regulation 32C of the Financial Advisers Regulations. Where the research is distributed in Singapore to a person who is not an Accredited Investor, Expert Investor or an Institutional Investor, IGA accepts legal responsibility for the contents of the report to such persons only to the extent required by law. Singapore recipients should contact IGA at 6390 5118 for matters arising from, or in connection with the information distributed.
The information/research herein is prepared by IG Asia Pte Ltd (IGA) and its foreign affiliated companies (collectively known as the IG Group) and is intended for general circulation only. It does not take into account the specific investment objectives, financial situation, or particular needs of any particular person. You should take into account your specific investment objectives, financial situation, and particular needs before making a commitment to trade, including seeking advice from an independent financial adviser regarding the suitability of the investment, under a separate engagement, as you deem fit.
No representation or warranty is given as to the accuracy or completeness of this information. Consequently, any person acting on it does so entirely at their own risk. Please see important Research Disclaimer.
Please also note that the information does not contain a record of our trading prices, or an offer of, or solicitation for, a transaction in any financial instrument. Any views and opinions expressed may be changed without an update.

Seize a share opportunity today
Go long or short on thousands of international stocks.
- Increase your market exposure with leverage
- Get spreads from just 0.1% on major global shares
- Trade CFDs straight into order books with direct market access
Live prices on most popular markets
- Forex
- Shares
- Indices
See more forex live prices
See more shares live prices
Prices above are subject to our website terms and agreements. Prices are indicative only. All shares prices are delayed by at least 15 mins.
See more indices live prices
Prices above are subject to our website terms and agreements. Prices are indicative only. All shares prices are delayed by at least 20 mins.
