Lacklustre start to the final week of June: Copper, Nikkei 225, EUR/GBP
Wall Street added to recent losses overnight, as the moderation from previous overbought technical conditions and extreme bullish sentiments continues.


Market Recap
Wall Street added to recent losses overnight (DJIA -0.04%; S&P 500 -0.45%; Nasdaq -1.16%), as the moderation from previous overbought technical conditions and extreme bullish sentiments continues. Amid the relatively quiet US economic calendar to start the week, a series of downgrades in the technology space such as Alphabet and Tesla seem to take on much focus, triggering some profit-taking from its recent stellar outperformance. Market participants rotated into value sectors, with strength in real estate (+2.2%) and energy sector (+1.7%). The VIX is also up 6% as a sign of increased hedging activities on renewed caution.
The day ahead will leave comments from European Central Bank (ECB) President Christine Lagarde on watch. Recession talks are were amplified yesterday with a lower-than-expected read in Germany IFO business climate index (88.5 versus 90.7 forecast) and its second straight month of decline, but she is likely to join the hawkish chorus from central bankers in terms of monetary policies. Canada’s inflation data is lined up on the economic calendar, with expectations for further progress to be made in its inflation fight. US durable goods orders and consumer confidence data will also be in focus tonight to provide further clues on soft-landing chatters.
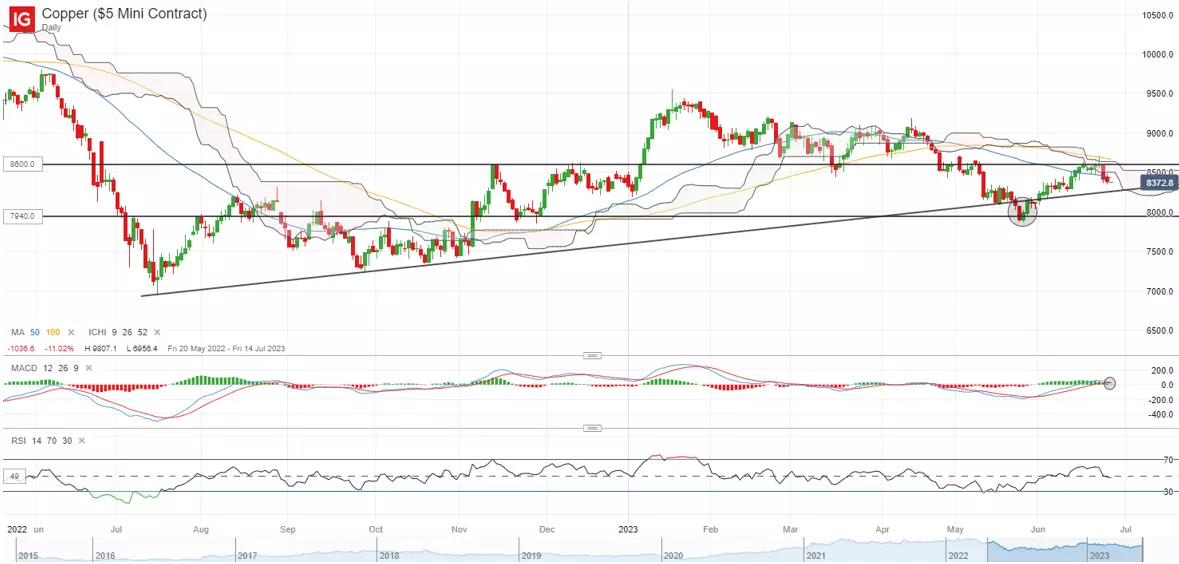
Following a 10% rebound over the past month, copper prices are facing strong resistance at the US$8,600/tonne level, where a previous support-turned-resistance stands in line with the upper edge of the Ichimoku cloud on the daily chart. A bearish crossover on moving average convergence/divergence (MACD) points to a reversal in momentum as the relative strength index (RSI) flirts with the key 50 level. China’s Purchasing Managers' Index (PMI) data will be released this week, and given that any positive impact from recent round of monetary easing measures may come with some lag, another set of lacklustre readings in its June PMI remains on the table.
Asia Open
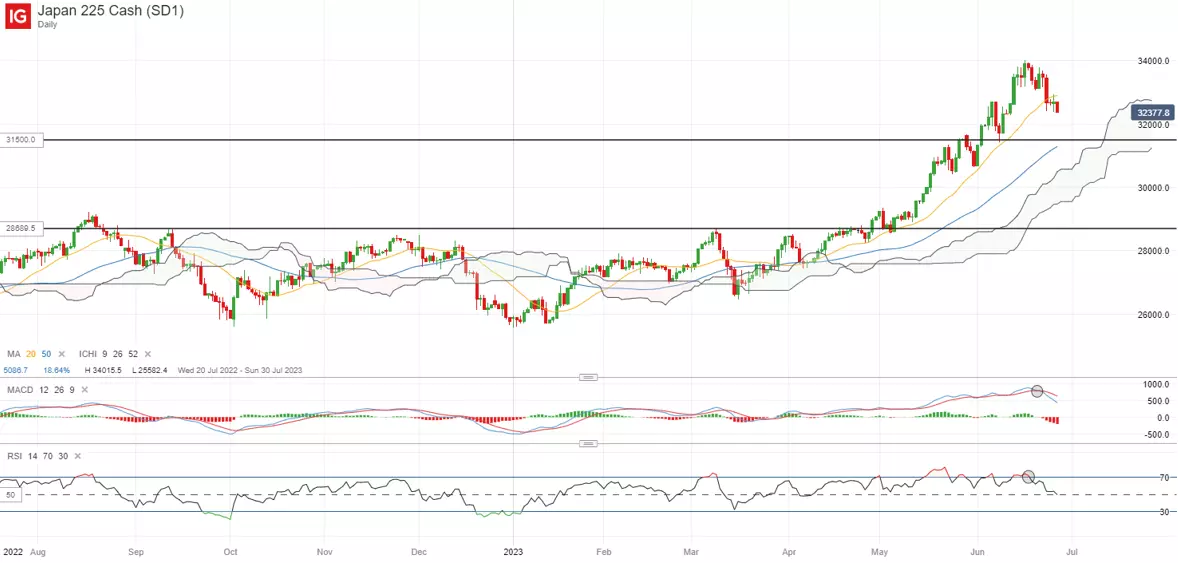
Asian stocks look set for a mixed open, with Nikkei -0.54%, ASX +0.39% and KOSPI -0.34% at the time of writing. Chinese equities saw some slight resilience overnight, with the Nasdaq Golden Dragon China Index eking out a 0.2% gain despite the downbeat Wall Street performance. For the Nikkei, the 20-day moving average (MA) has given way, which is a key MA line supporting the index on at least four occasions over the past two months. As the index continues to moderate from overbought technical conditions, further downside may leave the 31,500 level on watch next, where previous dip-buying efforts were sighted in early-June.
Closer to home, Singapore’s industrial production painted a gloomy growth outlook, with its eight straight month of contraction. The degree of underperformance is significant as well, with production down 10.8% year-on-year versus an expected 7.4% contraction, tracking a similar decline in its non-oil domestic exports. The electronics segment continued to be a drag on growth, contracting 23% from a year ago and accounting for 45% of the overall manufacturing sector. Being highly sensitive to external demand, a low-for-longer growth outlook for Singapore seems to be the takeaway, with a dimmer economic outlook and a global tech downcycle at play.
On the watchlist: EUR/GBP attempting to defend key support
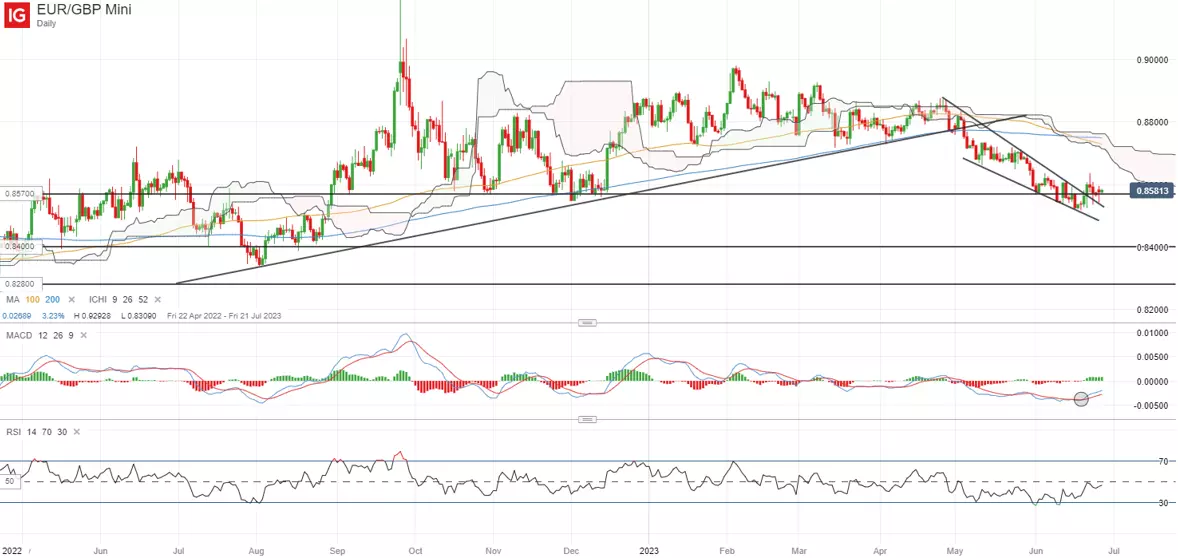
Having broken above a near-term descending wedge on the daily chart last week, buyers are now attempting to defend a key support at the 0.857 level, as revealed in the formation of a bullish long-legged doji overnight. That said, more clarity awaits, with its RSI still trending below the key 50 level while its 20-day MA is standing in the way as immediate resistance. Policy divergence remains the key driving force for the pair, as UK inflation not moderating as quickly as the Eurozone suggests that more hawkishness is being priced for the BoE as compared to the ECB. Comments from ECB President Christine Lagarde will be on the radar later today. Failure to defend the 0.857 level over the coming days may point to some exhaustion, which may pave the way to retest the 0.840 level next.
Monday: DJIA -0.04%; S&P 500 -0.45%; Nasdaq -1.16%, DAX -0.11%, FTSE -0.11%
IGA, may distribute information/research produced by its respective foreign affiliates within the IG Group of companies pursuant to an arrangement under Regulation 32C of the Financial Advisers Regulations. Where the research is distributed in Singapore to a person who is not an Accredited Investor, Expert Investor or an Institutional Investor, IGA accepts legal responsibility for the contents of the report to such persons only to the extent required by law. Singapore recipients should contact IGA at 6390 5118 for matters arising from, or in connection with the information distributed.
The information/research herein is prepared by IG Asia Pte Ltd (IGA) and its foreign affiliated companies (collectively known as the IG Group) and is intended for general circulation only. It does not take into account the specific investment objectives, financial situation, or particular needs of any particular person. You should take into account your specific investment objectives, financial situation, and particular needs before making a commitment to trade, including seeking advice from an independent financial adviser regarding the suitability of the investment, under a separate engagement, as you deem fit.
No representation or warranty is given as to the accuracy or completeness of this information. Consequently, any person acting on it does so entirely at their own risk. Please see important Research Disclaimer.
Please also note that the information does not contain a record of our trading prices, or an offer of, or solicitation for, a transaction in any financial instrument. Any views and opinions expressed may be changed without an update.

Seize a share opportunity today
Go long or short on thousands of international stocks.
- Increase your market exposure with leverage
- Get spreads from just 0.1% on major global shares
- Trade CFDs straight into order books with direct market access
Live prices on most popular markets
- Forex
- Shares
- Indices
See more forex live prices
See more shares live prices
Prices above are subject to our website terms and agreements. Prices are indicative only. All shares prices are delayed by at least 15 mins.
See more indices live prices
Prices above are subject to our website terms and agreements. Prices are indicative only. All shares prices are delayed by at least 20 mins.
