Fed’s rate expectations see-sawed overnight: Copper, Hang Seng Index, AUD/NZD
With market participants still largely trying to comprehend the Fed’s policy path ahead, rate expectations had fluctuated widely overnight.

Market Recap
With market participants still largely trying to comprehend the Federal Reserve’s (Fed) policy path ahead, rate expectations had fluctuated widely overnight, revealing its sensitivity to a series of economic data and Fedspeak. A still-resilient US labour market supported by a renewed increase in US April job openings (10.1mn versus previous 9.7mn) initially triggered a surge in hawkish bets, only for Fed officials’ comments to put a June rate-pause scenario back into place thereafter.
Federal Reserve Governor Philip Jefferson and Philadelphia Federal Reserve President Patrick Harker (both voting members) has shown their incline towards keeping rates on hold in June for now, which has market pricing for a 67% probability of that scenario by the end of the day. Of course, much will still depend on the upcoming US non-farm payroll and May consumer price index (CPI) reading to anchor rate views.
As we head into the US job report on Friday, signs of weakness in the US labour market will be the justification needed for any policy flexibility. Current consensus is for 190,000 job additions versus 253,000 in April, but with the data exceeding expectations on 11 out of the previous 12 readings, market participants may be somewhat prepared for an upside surprise. The extent of outperformance could hence be the key here. Unemployment rate is expected to tick higher to 3.5% from previous 3.4%, while average hourly earnings is expected to moderate to 0.3% from the previous month.
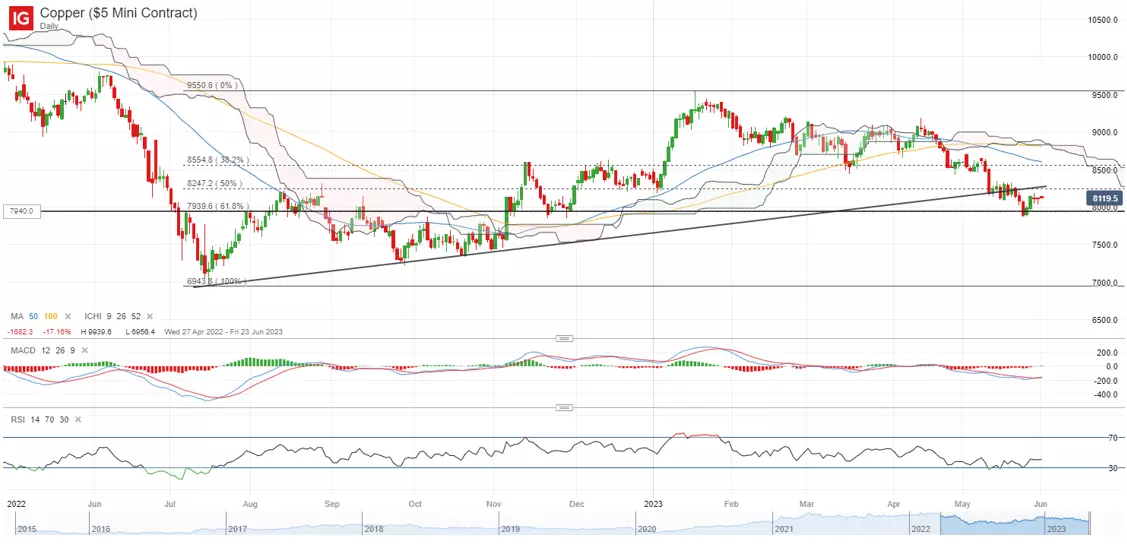
Treasury yields were broadly lower, leading the US dollar to pare back on its initial gains. Another downside surprise in China’s official Purchasing Managers' Index (PMI) readings led oil prices back to retest its May 2023 bottom. Gold prices managed to gain some footing after defending a support confluence at the US$1,940 level, but a series of resistance still present a challenge for the yellow metal. Copper prices have held their ground despite the weaker China’s data, largely with expectations being priced to some extent with a 13% decline over the past two months. That said, the US$8,250/ton level remains a key resistance ahead, having broken below a key upward trendline last week which will now serve as a hurdle to overcome.
Asia Open
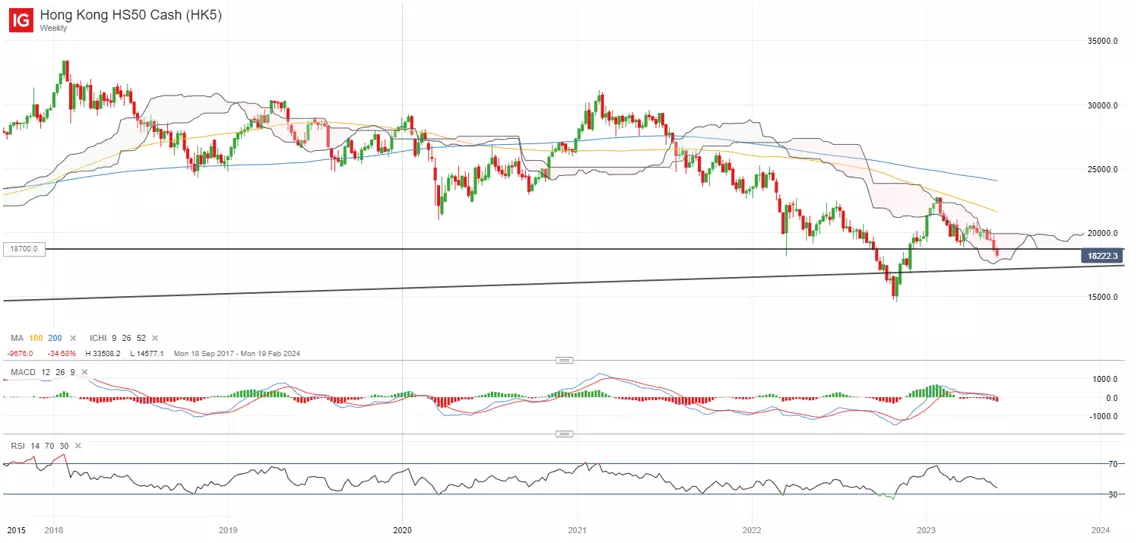
Asian stocks look set for a mixed open, with Nikkei +0.60%, ASX -0.10% and KOSPI -0.30% at the time of writing. Hang Seng Index dipping into bear market territory has been the headline yesterday, prompted by yet another lacklustre reading in China’s official PMI. You can read more about it here.
To add to the weak global economic demand outlook, South Korea’s exports marked its 8th straight month of contraction albeit a slight beat of expectations (-15.2% year-on-year versus -16.8% consensus). Overall, the weak showing served as a bellwether for a dimmer global economic outlook and a global tech downcycle playing out, with no clear signs of any bottoming yet.
For the Hang Seng Index, the weekly chart has revealed a struggle for the index in moving past the upper edge of the Ichimoku cloud since the start of the year, leaving it as a key resistance to overcome, to put buyers in control. A bearish centreline crossover on the weekly Moving Average Convergence/Divergence (MACD) provides a confirmation signal for the negative momentum in place and until the Ichimoku cloud resistance is overcome, the trend could remain downward bias for now.
On the watchlist: AUD/NZD facing key test of resistance ahead
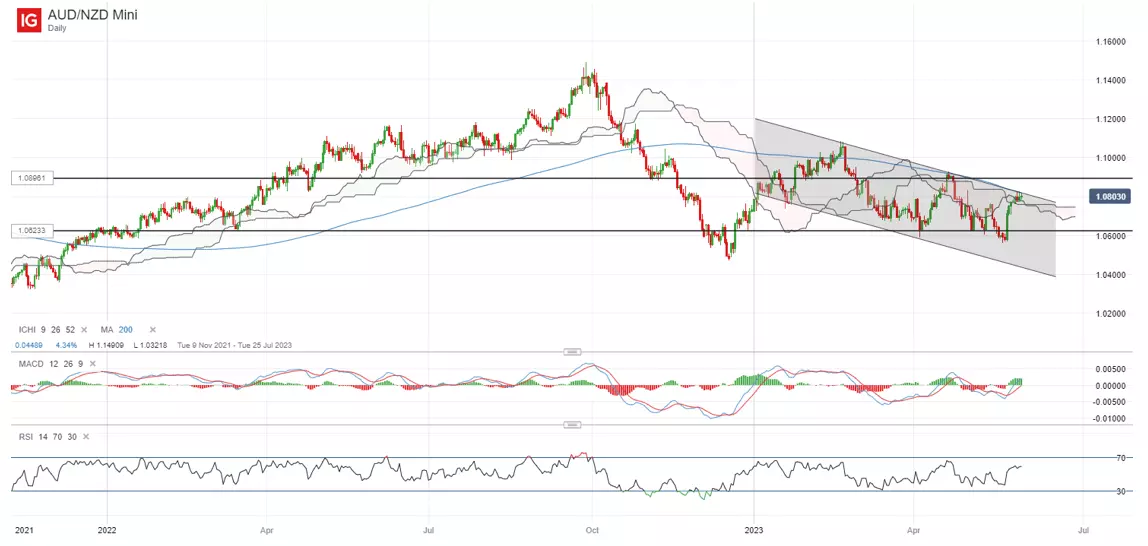
A recent dovish guidance from the Reserve Bank of New Zealand (RBNZ) has left market participants pricing for a peak in its tightening cycle, but sticky inflation in Australia seems to keep the pressure for the Reserve Bank of Australia (RBA) to deliver additional tightening. The AUD/NZD was largely on a drift lower since late-April this year, only for a surprise outcome in the previous RBNZ meeting to trigger an upswing over the past week.
That has brought the AUD/NZD back to retest a key resistance zone at the 1.082 level, where its 200-day moving average (MA) and upper channel trendline resistance coincide. The presence of long-tailed candlestick revealed the presence of strong selling pressure at this level, forcing the pair into a near-term consolidation for now.
Any failure to cross the channel resistance could mark another lower high for the pair since February this year, potentially paving the way to retest the 1.062 level, where a series of bottoms were presented over the past two months. On the other hand, a breakout above the channel could allow the pair to set its sight to retest the April 2023 high at the 1.093 level.
Wednesday: DJIA -0.41%; S&P 500 -0.61%; Nasdaq -0.63%, DAX -1.54%, FTSE -1.01%
IGA, may distribute information/research produced by its respective foreign affiliates within the IG Group of companies pursuant to an arrangement under Regulation 32C of the Financial Advisers Regulations. Where the research is distributed in Singapore to a person who is not an Accredited Investor, Expert Investor or an Institutional Investor, IGA accepts legal responsibility for the contents of the report to such persons only to the extent required by law. Singapore recipients should contact IGA at 6390 5118 for matters arising from, or in connection with the information distributed.
The information/research herein is prepared by IG Asia Pte Ltd (IGA) and its foreign affiliated companies (collectively known as the IG Group) and is intended for general circulation only. It does not take into account the specific investment objectives, financial situation, or particular needs of any particular person. You should take into account your specific investment objectives, financial situation, and particular needs before making a commitment to trade, including seeking advice from an independent financial adviser regarding the suitability of the investment, under a separate engagement, as you deem fit.
No representation or warranty is given as to the accuracy or completeness of this information. Consequently, any person acting on it does so entirely at their own risk. Please see important Research Disclaimer.
Please also note that the information does not contain a record of our trading prices, or an offer of, or solicitation for, a transaction in any financial instrument. Any views and opinions expressed may be changed without an update.

Seize a share opportunity today
Go long or short on thousands of international stocks.
- Increase your market exposure with leverage
- Get spreads from just 0.1% on major global shares
- Trade CFDs straight into order books with direct market access
Live prices on most popular markets
- Forex
- Shares
- Indices
See more forex live prices
See more shares live prices
Prices above are subject to our website terms and agreements. Prices are indicative only. All shares prices are delayed by at least 15 mins.
See more indices live prices
Prices above are subject to our website terms and agreements. Prices are indicative only. All shares prices are delayed by at least 20 mins.
