EUR/USD, EUR/GBP and GBP/USD outlook ahead major central bank meetings
Outlook on EUR/USD, EUR/GBP and GBP/USD ahead of US inflation and Fed, ECB and BoE rate decisions.


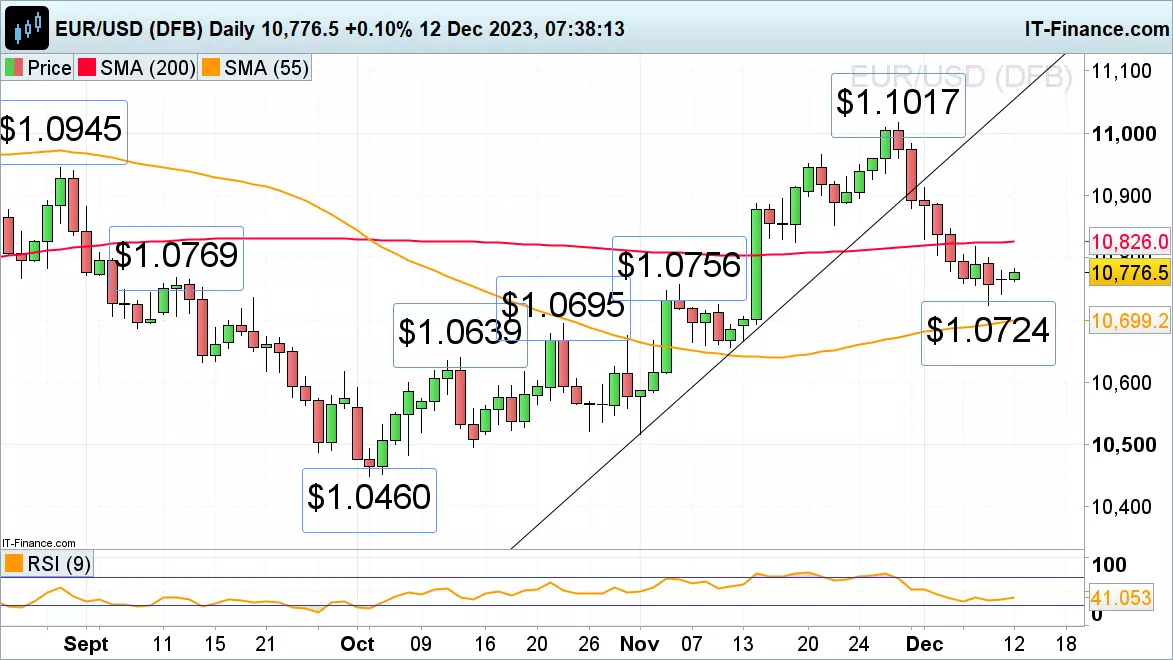
EUR/USD muted ahead of US inflation data release
EUR/USD continues to range trade in low volatility ahead of Tuesday’s US Consumer Price Index (CPI) release for November which is forecast to come in at 3.1% versus 3.2% previously and at 4% for core inflation.
While last week’s low at $1.0724 underpins, Friday’s high at $1.08 is likely to be exceeded with Thursday’s high and the 200-day simple moving average (SMA) at $1.0817 to $1.0826 then being eyed. Further up the 22 November low at $1.0853 may also act as resistance, were it to be reached at all.
A fall through $1.0724 would probably put the 55-day SMA and late-October high at $1.0699 to $1.0695 on the plate, though.
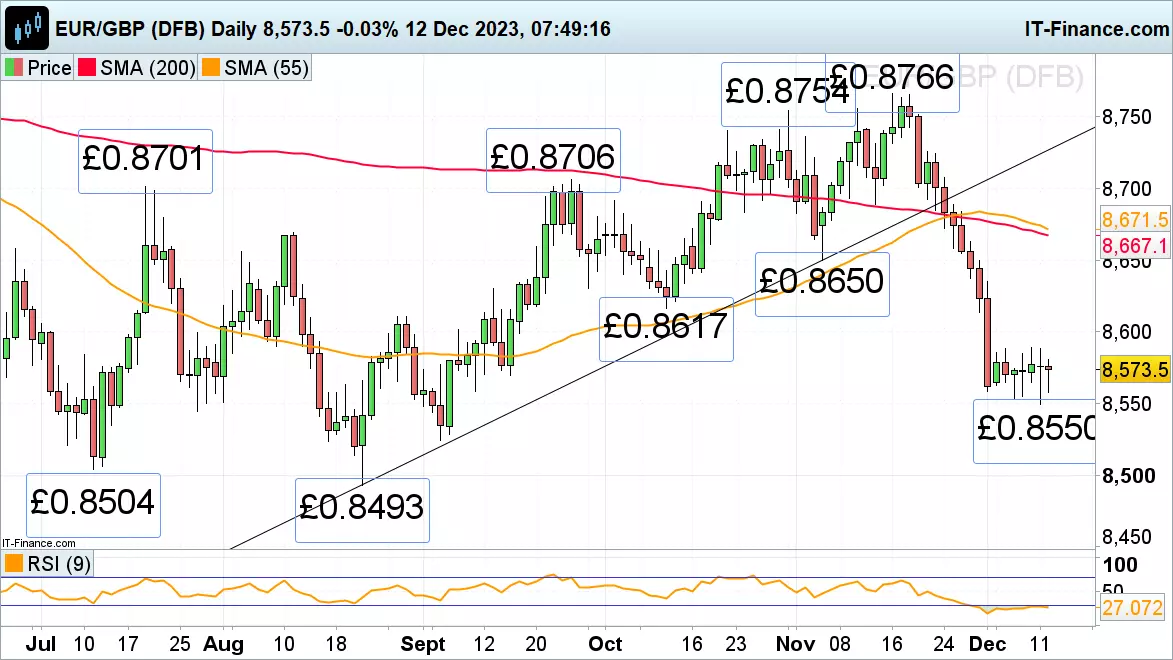
EUR/GBP sideways trades above this week’s £0.8550 low
EUR/GBP's drastic decline from its six-month high at £0.8766, amid the European Central Bank's (ECB) less hawkish stance than that of the Bank of England (BoE), has so far taken it to a three-month low at £0.855.
Further sideways trading in low volatility is expected to be witnessed over the coming days, with Tuesday’s lower-than-forecast wage growth not making a dent. Only a rise above last week’s high at £0.8588 could lead to the mid-October low at £0.8617 being revisited. Together with the £0.865 early-November low it is expected to act as resistance, though, if reached at all that is.
Failure at £0.855 would put the July and August lows at £0.8504 to £0.8493 back in sight.
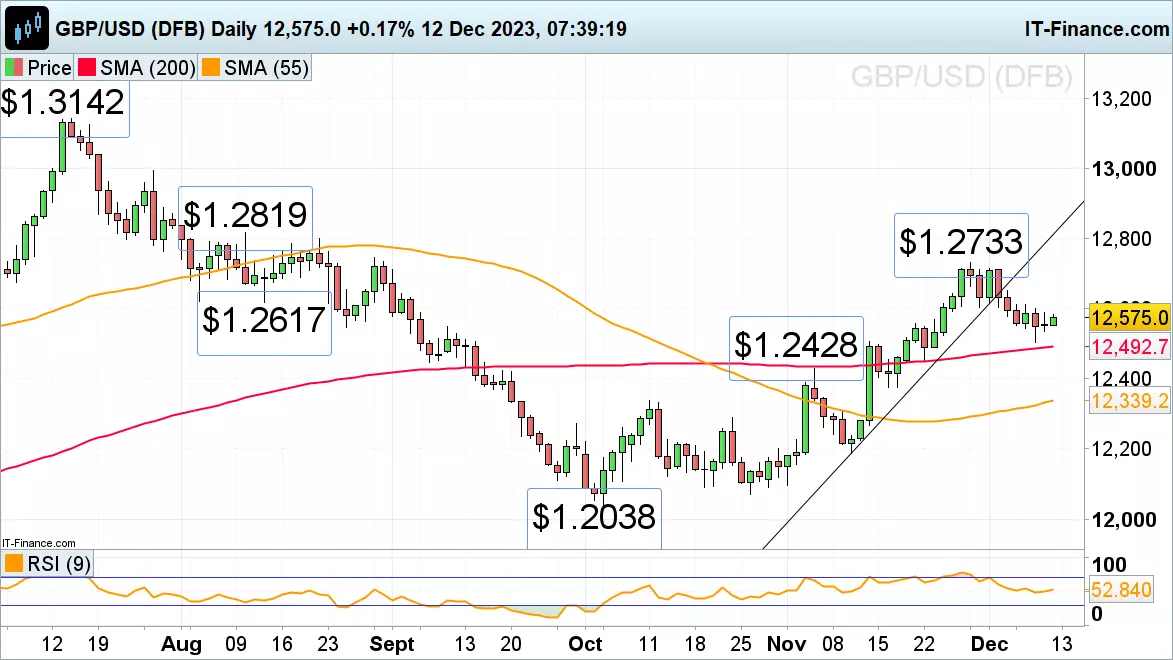
GBP/USD range trades ahead of US CPI reading
GBP/USD’s slip from last week’s near three-month high at $1.2733, on a strengthening US dollar amid solid US Non-Farm Payrolls, took it close to the 200-day SMA at $1.2493 which continues to underpin.
While it holds, minor resistance around the end of November $1.2604 low may be reached ahead of Tuesday’s US inflation data release.
Further minor resistance can be found around last Tuesday’s $1.2651 high.
IGA, may distribute information/research produced by its respective foreign affiliates within the IG Group of companies pursuant to an arrangement under Regulation 32C of the Financial Advisers Regulations. Where the research is distributed in Singapore to a person who is not an Accredited Investor, Expert Investor or an Institutional Investor, IGA accepts legal responsibility for the contents of the report to such persons only to the extent required by law. Singapore recipients should contact IGA at 6390 5118 for matters arising from, or in connection with the information distributed.
The information/research herein is prepared by IG Asia Pte Ltd (IGA) and its foreign affiliated companies (collectively known as the IG Group) and is intended for general circulation only. It does not take into account the specific investment objectives, financial situation, or particular needs of any particular person. You should take into account your specific investment objectives, financial situation, and particular needs before making a commitment to trade, including seeking advice from an independent financial adviser regarding the suitability of the investment, under a separate engagement, as you deem fit.
No representation or warranty is given as to the accuracy or completeness of this information. Consequently, any person acting on it does so entirely at their own risk. Please see important Research Disclaimer.
Please also note that the information does not contain a record of our trading prices, or an offer of, or solicitation for, a transaction in any financial instrument. Any views and opinions expressed may be changed without an update.

Start trading forex today
Trade the largest and most volatile financial market in the world.
- Spreads start at just 0.6 points on EUR/USD
- Analyse market movements with our essential selection of charts
- Speculate from a range of platforms, including on mobile
Live prices on most popular markets
- Forex
- Shares
- Indices
See more forex live prices
See more shares live prices
Prices above are subject to our website terms and agreements. Prices are indicative only. All shares prices are delayed by at least 15 mins.
See more indices live prices
Prices above are subject to our website terms and agreements. Prices are indicative only. All shares prices are delayed by at least 20 mins.
