EUR/USD, GBP/USD try to stabilize amid heightened Middle East tensions while EUR/GBP pauses
Outlook on EUR/USD, EUR/GBP and GBP/USD amid the ongoing Israel/Hamas crisis.

EUR/USD tries to hold amid heightened Middle East tensions
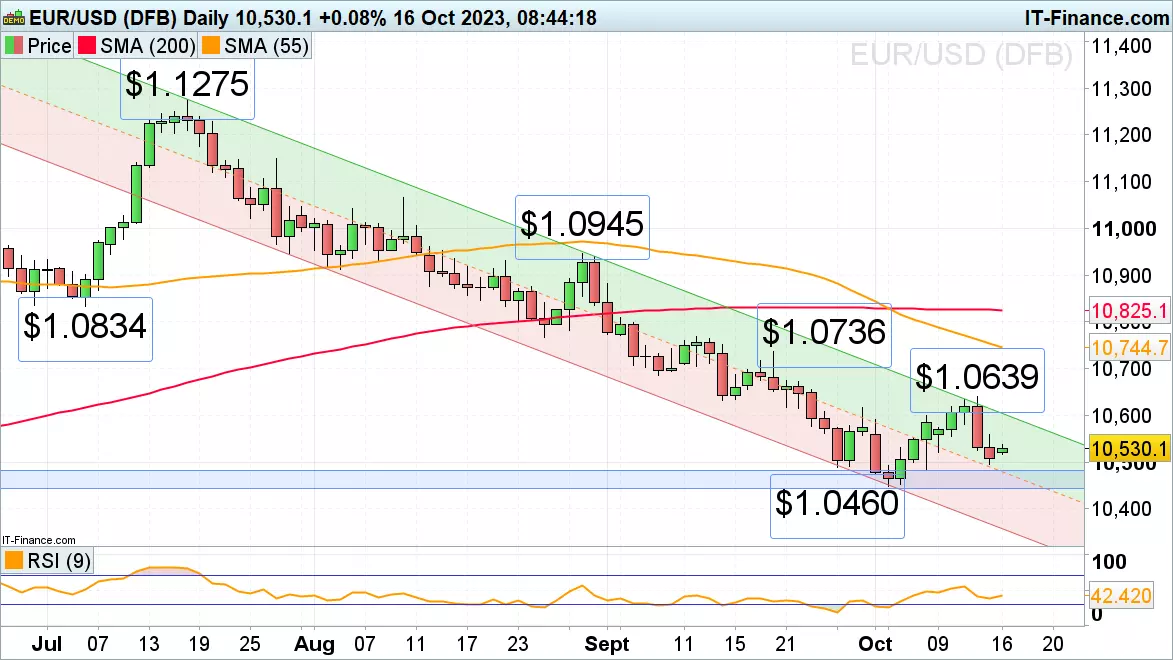
Last week’s EUR/USD rejection by the upper July-to-October downtrend channel resistance line at $1.0639 has been followed by a swift sell-off as US consumer price index (CPI) inflation came in slightly higher-than-expected and heightened Middle East tensions led to safe haven flows into the US dollar.
Below Friday’s low at $1.0496 lies the key $1.0484 to $1.0444 support zone, made up of the mid-November high, 7 December and 6 January lows. Provided it holds, the pair may still bottom out from a medium-term perspective.
Minor resistance sits at Friday’s $1.0558 high and further up at the previous Friday’s high at $1.06 and then the late September high at $1.0617. Further resistance sits at the May low and mid-September low as well as this week’s high at $1.0632 to $1.0639. Only a rise and daily chart close above these levels would confirm a bottoming formation.
EUR/GBP recovers from last Friday’s £0.8617 low
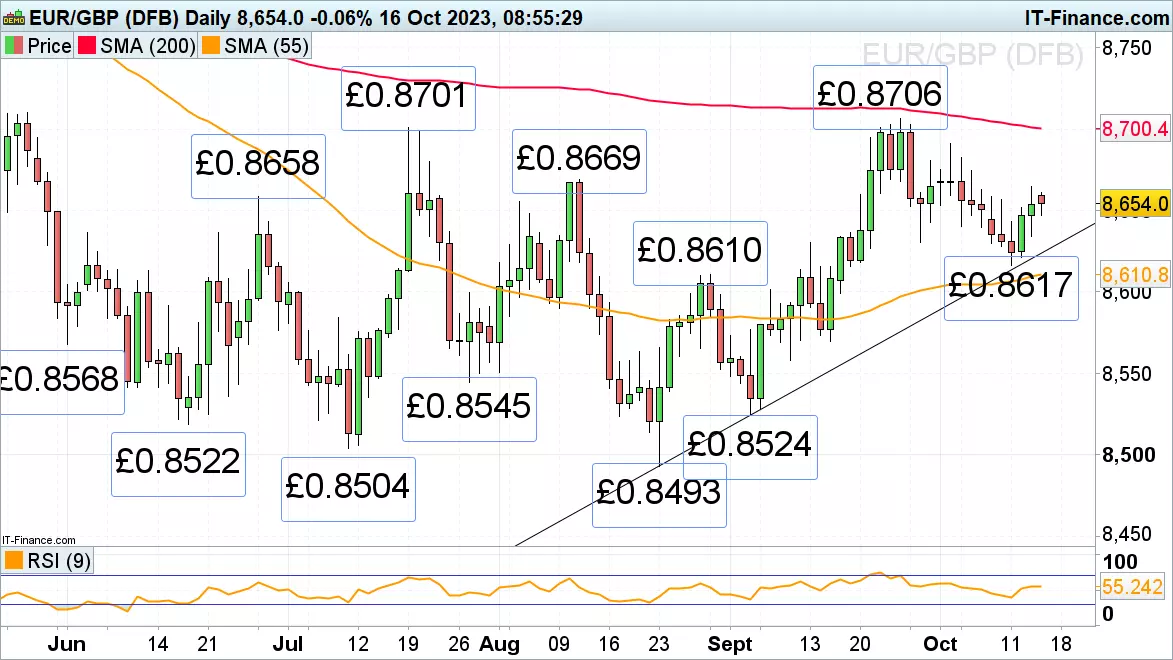
EUR/GBP’s descent from its £0.8706 September high has taken it to last week’s £0.8617 low from where the cross is currently recovering ahead of Wednesday’s UK inflation data.
Good support now sits between the late August high, late September low and last week’s low at £0.8631 to £0.861 while minor resistance comes in at last week’s high at £0.8664. Above it sit the late June and mid-August highs at £0.8658 to £0.8669 which are likely to cap, if reached.
GBP/USD tries to stabilize following last week’s sharp sell-off
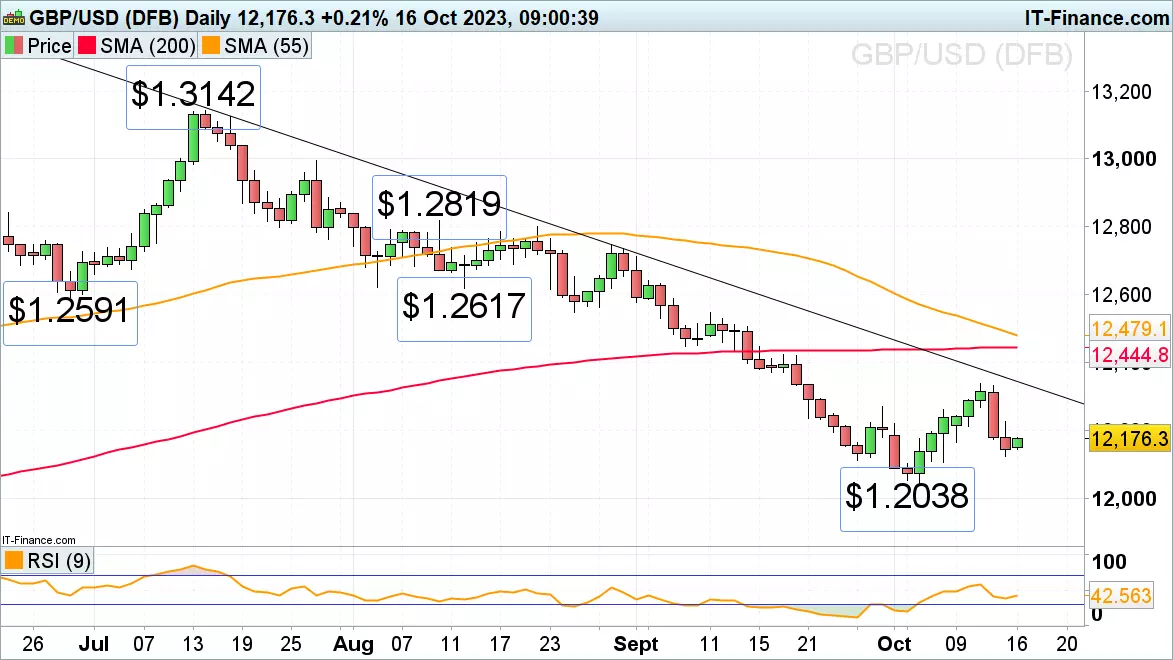
GBP/USD’s rise from its early October seven-month low at $1.2038, for six straight days to last week’s $1.2337 high was followed by a sharp sell-off as the Israel/Hamas war led to flight-to-safety flows into the greenback.
A drop through Friday’s low at $1.2123 and the next lower $1.2106 previous Friday low could lead to the early October low at $1.2038 and the psychological $1.20 mark being revisited.
While Friday’s low at $1.2123 underpins, though, Friday’s high at $1.2225 may be retested. If overcome, the late September high at $1.2271 would be back in the frame.
IGA, may distribute information/research produced by its respective foreign affiliates within the IG Group of companies pursuant to an arrangement under Regulation 32C of the Financial Advisers Regulations. Where the research is distributed in Singapore to a person who is not an Accredited Investor, Expert Investor or an Institutional Investor, IGA accepts legal responsibility for the contents of the report to such persons only to the extent required by law. Singapore recipients should contact IGA at 6390 5118 for matters arising from, or in connection with the information distributed.
The information/research herein is prepared by IG Asia Pte Ltd (IGA) and its foreign affiliated companies (collectively known as the IG Group) and is intended for general circulation only. It does not take into account the specific investment objectives, financial situation, or particular needs of any particular person. You should take into account your specific investment objectives, financial situation, and particular needs before making a commitment to trade, including seeking advice from an independent financial adviser regarding the suitability of the investment, under a separate engagement, as you deem fit.
No representation or warranty is given as to the accuracy or completeness of this information. Consequently, any person acting on it does so entirely at their own risk. Please see important Research Disclaimer.
Please also note that the information does not contain a record of our trading prices, or an offer of, or solicitation for, a transaction in any financial instrument. Any views and opinions expressed may be changed without an update.

Start trading forex today
Trade the largest and most volatile financial market in the world.
- Spreads start at just 0.6 points on EUR/USD
- Analyse market movements with our essential selection of charts
- Speculate from a range of platforms, including on mobile
Live prices on most popular markets
- Forex
- Shares
- Indices
See more forex live prices
See more shares live prices
Prices above are subject to our website terms and agreements. Prices are indicative only. All shares prices are delayed by at least 15 mins.
See more indices live prices
Prices above are subject to our website terms and agreements. Prices are indicative only. All shares prices are delayed by at least 20 mins.
