Cautious tone to start the new week: Brent crude, China A50, USD/JPY
The value-growth divide since the start of the month continued to play out last Friday, as market participants pare their exposure in US big tech and semiconductors, while value sectors held firm.


Market Recap
The value-growth divide since the start of the month continued to play out last Friday, as market participants pare their exposure in US big tech and semiconductors, while value sectors held firm with a notable pull-ahead in the energy sector (+1.6%).
Some unease were triggered by the upside surprise in US producer prices, but for now, it will still have to take much more to convince markets of a September Federal Reserve (Fed) rate hike. Current rate expectations from the Fed feds futures pricing remained firm that the Fed’s tightening cycle has already reached its end, with potential rate cuts in May next year. To end last week, US Treasury yields largely resumed their move higher, with the 10-year yields bouncing off its 4% level lately to attempt a move to a new year-to-date high.
The day ahead will be relatively quiet on the economic calendar front, which could drive a more subdued tone to start the week, but focus will be turned to Japan’s 2Q gross domestic product (GDP) release tomorrow, along with the Reserve Bank of Australia (RBA) minutes and a series of economic data out of China to drive more market action.
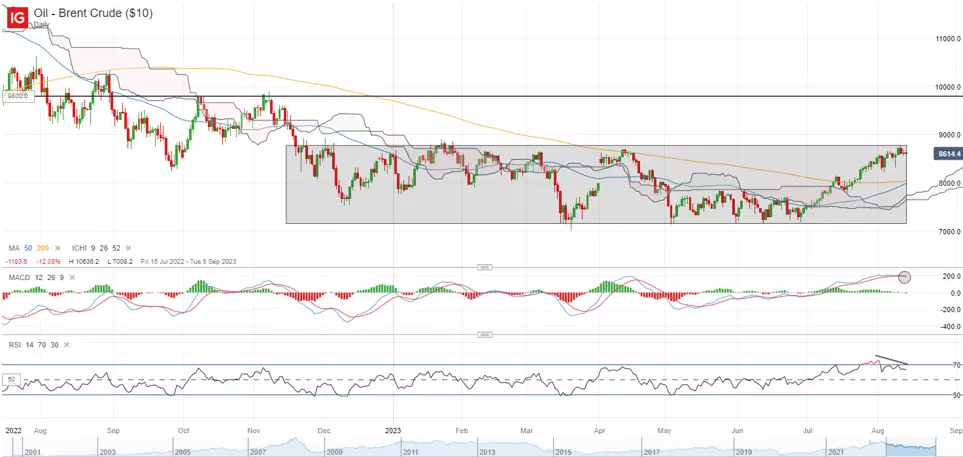
One to watch may be Oil - Brent Crude prices, which continue to hover below its US$88.00 level of resistance. A bearish crossover on the moving average divergence convergence (MACD) may point to some near-term exhaustion, but a pull-ahead of its weekly relative strength index (RSI) back above the 50 level lately may suggest buyers taking greater control. Any reclaim of the US$88.00 level may potentially pave the way to retest its November 2022 high at the US$98.00 level.
Asia Open
Asian stocks look set for a weak open, with Nikkei -0.33%, ASX -0.38% and KOSPI -0.62% at the time of writing. China’s economic woes resumed with new bank loans for July tumbling to end last week (CNY345.9 billion versus CNY800 billion forecast), while a slump in foreign direct investment (April-June quarter) to its record low prompted China authorities to react with a list of guidelines to attract more foreign investments. That said, having been accustomed to the series of policy responses from authorities thus far, sentiments seem to be at the stage where they will want to see supportive policies translating into actual results.
Into the new week, fresh updates on China’s retail sales, industrial production and fixed asset investment figures will be on watch tomorrow. An uneven recovery in the numbers is expected to be the story, with industrial production to remain unchanged while retail sales are expected to rise to 4.7% year-on-year from previous 3.1%.
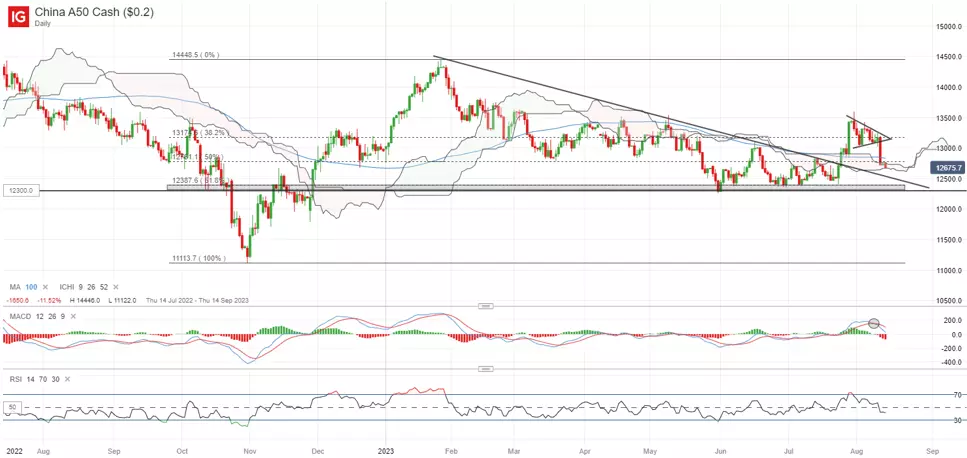
For the China A50 index, a recent bullish pennant formation on the daily chart failed to find an upward break, with sellers jumping in last week to put the index on a three-week low. With that, the 13,200 level will be a key resistance level to overcome ahead, while further downside may leave the 12,300-12,500 range on watch, where a previous downward trendline stands alongside its year-to-date bottom.
On the watchlist: USD/JPY back to retest its year-to-date high
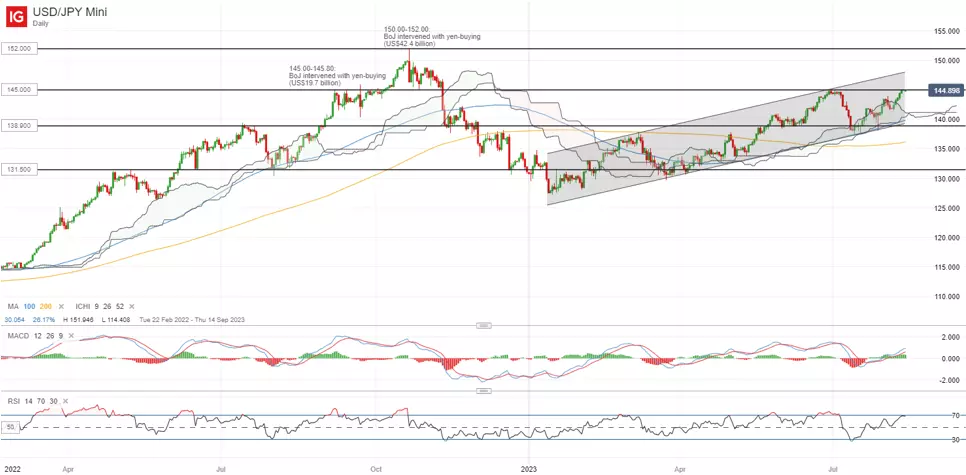
Market participants have been unfazed by the more flexible policy approach from the Bank of Japan (BoJ) thus far, with a continued rise in the US-Japan 10-year bond yield spread lifting the USD/JPY back to retest its year-to-date high at the 145.00 level. Previous retest of the level in June this year was met with some jawboning of yen intervention by Japanese authorities, but traders may be seeking for any concrete follow-through this time round.
For now, the overall upward bias in the pair remains intact, with the pair trading within an ascending channel pattern since the start of the year and its weekly RSI holding above the 50 level lately. On any downside, the 138.90 level will be on watch as near-term support from its 100-day moving average (MA), in coincidence with the lower edge of its Ichimoku cloud on the daily chart.
Friday: DJIA +0.30%; S&P 500 -0.11%; Nasdaq -0.56%, DAX -1.03%, FTSE -1.24%
IGA, may distribute information/research produced by its respective foreign affiliates within the IG Group of companies pursuant to an arrangement under Regulation 32C of the Financial Advisers Regulations. Where the research is distributed in Singapore to a person who is not an Accredited Investor, Expert Investor or an Institutional Investor, IGA accepts legal responsibility for the contents of the report to such persons only to the extent required by law. Singapore recipients should contact IGA at 6390 5118 for matters arising from, or in connection with the information distributed.
The information/research herein is prepared by IG Asia Pte Ltd (IGA) and its foreign affiliated companies (collectively known as the IG Group) and is intended for general circulation only. It does not take into account the specific investment objectives, financial situation, or particular needs of any particular person. You should take into account your specific investment objectives, financial situation, and particular needs before making a commitment to trade, including seeking advice from an independent financial adviser regarding the suitability of the investment, under a separate engagement, as you deem fit.
No representation or warranty is given as to the accuracy or completeness of this information. Consequently, any person acting on it does so entirely at their own risk. Please see important Research Disclaimer.
Please also note that the information does not contain a record of our trading prices, or an offer of, or solicitation for, a transaction in any financial instrument. Any views and opinions expressed may be changed without an update.

Seize a share opportunity today
Go long or short on thousands of international stocks.
- Increase your market exposure with leverage
- Get spreads from just 0.1% on major global shares
- Trade CFDs straight into order books with direct market access
Live prices on most popular markets
- Forex
- Shares
- Indices
See more forex live prices
See more shares live prices
Prices above are subject to our website terms and agreements. Prices are indicative only. All shares prices are delayed by at least 15 mins.
See more indices live prices
Prices above are subject to our website terms and agreements. Prices are indicative only. All shares prices are delayed by at least 20 mins.
