Asia Day Ahead: Wait-and-see in lead-up to Fed’s decision, RBA minutes in focus
Market sentiments remained in its usual wait-and-see ahead of the FOMC meeting, as the VIX headed higher for the second straight day to reflect increased hedging activities.


Market Recap
Market sentiments remained in its usual wait-and-see ahead of the Federal Open Market Committee (FOMC) meeting this week, as the VIX headed higher for the second straight day to reflect increased hedging activities while major US indices ended the day flat.
On the other hand, US Treasury yields continued to hover around their multi-year highs, with expectations seemingly leaning towards a potential ‘hawkish pause’ scenario from the Federal Reserve (Fed). This is where the central bank keeps rates on hold at the upcoming meeting, but leaves the door open for one more rate hike by the end of this year as per its previous dot plot. Some pushback against recession risks by policymakers lately may support an upward revision in growth forecasts, but with soft landing hopes having to face off against a potential hawkish recalibration in rate expectations.
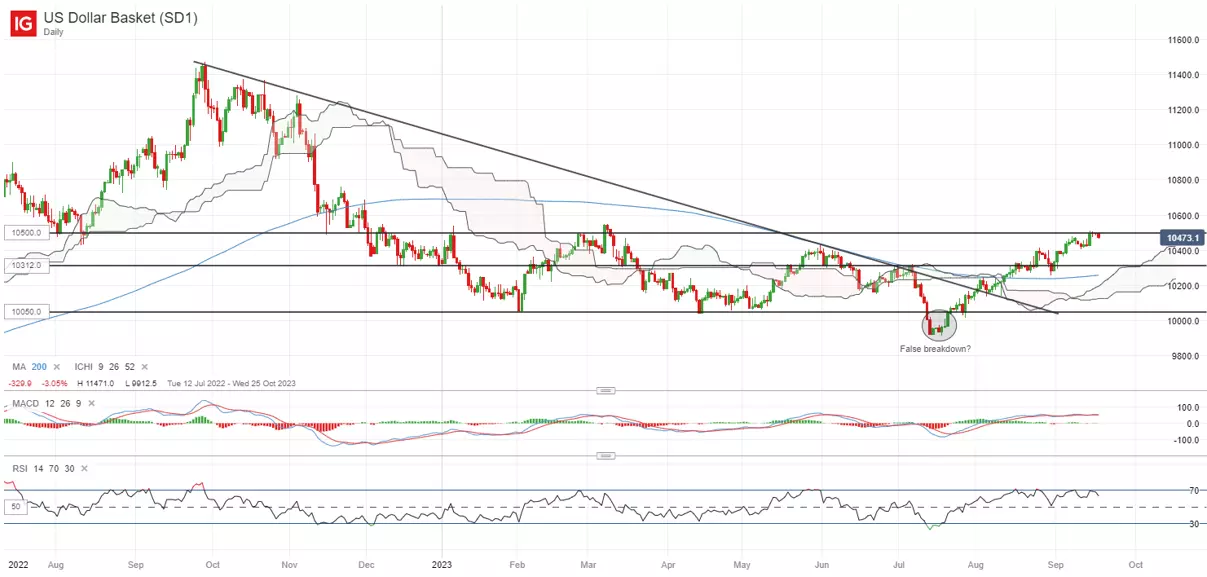
The US dollar continues to trade above its 200-day moving average (MA), with the formation of higher highs and higher lows since July this year, as market participants get more accustomed to a high-for-longer rate outlook. That said, the US dollar index is now back to retest a key resistance at the 105.00-105.60 range, which marks its year-to-date high.
Any successful move above this range may support a breakout of its months-long ranging pattern since December 2022, but a potential bearish divergence on relative strength index (RSI) points to some near-term exhaustion for now. The Commodity Futures Trading Commission (CFTC) data revealed that the aggregate net-short positioning for US dollar against other G10 currencies is at its lowest in three months, with any reversal into net-long positioning likely to support further upward bias based on historical instances.
Asia Open
Asian stocks look set for a downbeat open, with Nikkei -0.76%, ASX -0.32% and KOSPI +0.16% at the time of writing, as Japan markets return from its holiday break. Chinese equities remain in a mixed state yesterday, attempting to weigh between recent improvement in economic data and lingering default risks from Country Garden, which suggests that the property sector risks will likely drag for longer.
The Reserve Bank of Australia (RBA) meeting minutes will be in focus today. With the central bank keeping rates on hold for the third straight month at its September meeting, expectations are largely priced for the trend to continue through the rest of the year, with any confirmation to be sought from the upcoming minutes. At its previous meeting, the central bank retained its tightening bias, but also acknowledged growing economic risks from China and recent slowdown in inflation data, which seem to leave room for more wait-and-see for now.
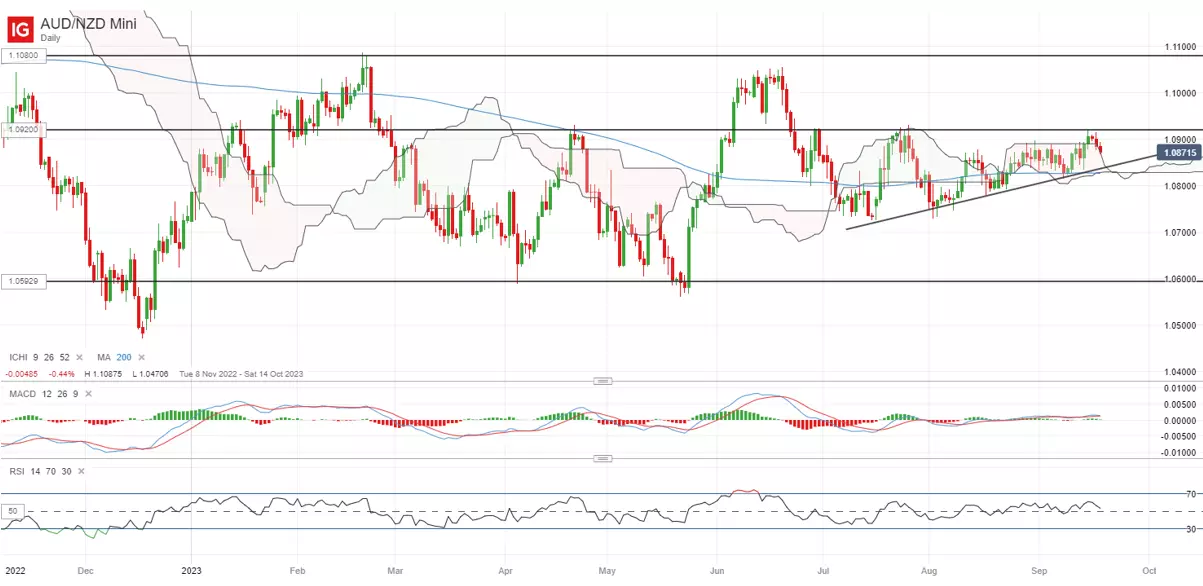
The AUD/NZD may be on watch, having been trading within an ascending triangle pattern since July this year, with the 1.092 level serving as an immediate resistance to overcome for buyers. Its daily RSI has been attempting to defend the key 50 level since August this year as well, which leaves buyers in some control for now. On the downside, the upward trendline support may be crucial to hold, failing which could pave the way to retest its July/August 2023 lows at the 1.073 level next.
On the watchlist: Silver prices attempting a bounce off support confluence
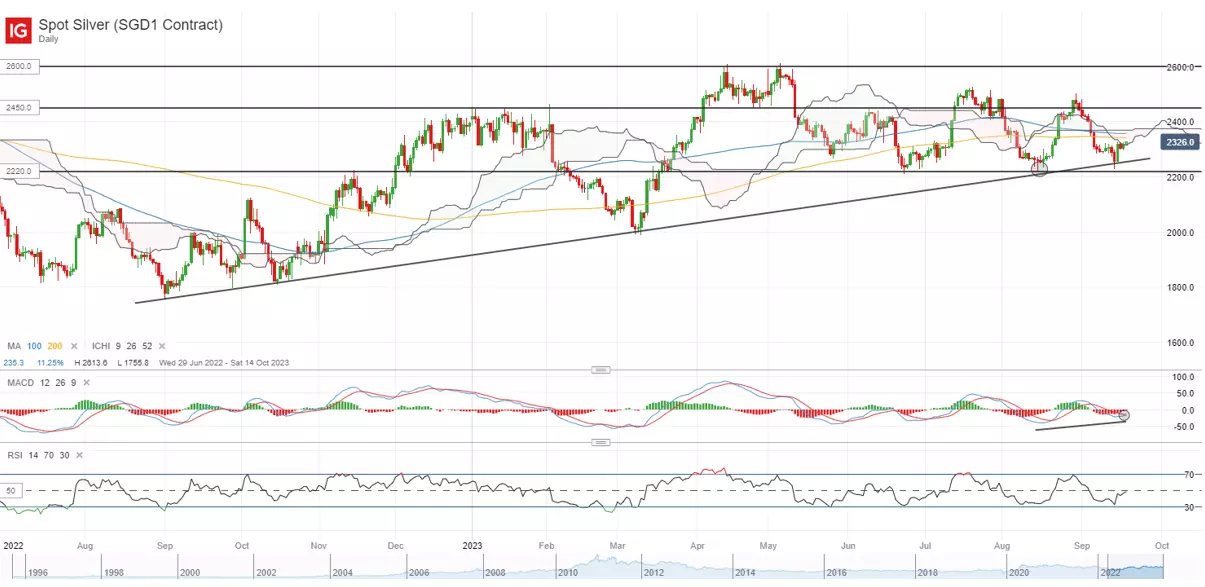
Silver prices have been attempting to hold up lately amid higher Treasury yields and US dollar strength, as buyers managed to defend the US$22.30 level, where an upward trendline support is in place since September 2022. Higher lows on Moving Average Convergence/Divergence (MACD) on the daily chart may point to some upward momentum in the near term, as prices may potentially eye for a retest of the US$24.50 level, where the upper edge of its ranging pattern resides.
On the weekly chart, a bullish pin bar formation was formed last week, with any positive follow-through on watch this week. Further upside may also validate a bullish crossover on daily MACD, which may potentially draw some technical buyers.
Monday: DJIA +0.02%; S&P 500 +0.07%; Nasdaq +0.01%, DAX -1.05%, FTSE -0.76%
IGA, may distribute information/research produced by its respective foreign affiliates within the IG Group of companies pursuant to an arrangement under Regulation 32C of the Financial Advisers Regulations. Where the research is distributed in Singapore to a person who is not an Accredited Investor, Expert Investor or an Institutional Investor, IGA accepts legal responsibility for the contents of the report to such persons only to the extent required by law. Singapore recipients should contact IGA at 6390 5118 for matters arising from, or in connection with the information distributed.
The information/research herein is prepared by IG Asia Pte Ltd (IGA) and its foreign affiliated companies (collectively known as the IG Group) and is intended for general circulation only. It does not take into account the specific investment objectives, financial situation, or particular needs of any particular person. You should take into account your specific investment objectives, financial situation, and particular needs before making a commitment to trade, including seeking advice from an independent financial adviser regarding the suitability of the investment, under a separate engagement, as you deem fit.
No representation or warranty is given as to the accuracy or completeness of this information. Consequently, any person acting on it does so entirely at their own risk. Please see important Research Disclaimer.
Please also note that the information does not contain a record of our trading prices, or an offer of, or solicitation for, a transaction in any financial instrument. Any views and opinions expressed may be changed without an update.

Seize a share opportunity today
Go long or short on thousands of international stocks.
- Increase your market exposure with leverage
- Get spreads from just 0.1% on major global shares
- Trade CFDs straight into order books with direct market access
Live prices on most popular markets
- Forex
- Shares
- Indices
See more forex live prices
See more shares live prices
Prices above are subject to our website terms and agreements. Prices are indicative only. All shares prices are delayed by at least 15 mins.
See more indices live prices
Prices above are subject to our website terms and agreements. Prices are indicative only. All shares prices are delayed by at least 20 mins.
