Asia Day Ahead: Relief in risk sentiments, with look-ahead to US jobs data later today
Overnight, Wall Street added to its recent gains on another dip in longer-term Treasury yields, as markets continue to bask in the hopes that the Fed is likely done with its rate hiking process.


Market Recap
Overnight, Wall Street added to its recent gains (DJIA +1.70%; S&P 500 +1.89%; Nasdaq +1.78%) on another dip in longer-term Treasury yields, as markets continue to bask in the hopes that the Federal Reserve (Fed) is likely done with its rate hiking process. A data-dependent Fed means that much may still easily shift over the coming months, but for now, there have clearly been more reservations from policymakers towards raising rates further, which provide the catalyst for extreme bearish sentiments to unwind.
Overnight economic data releases were encouraging for inflation dynamics as well, with labour costs contracting quarter-on-quarter in 3Q (-0.8% versus 0.7% forecast) while productivity accelerated (4.7% versus 4.1% forecast). But with Apple’s weak outlook for December quarter revenue, after-market moves in US equity futures have been more mixed.
Market attention today will also revolve around the US non-farm payroll report. Current expectations are for the labour market to show further signs of moderation to 180,000 job gains in October (previous 336,000), while the unemployment rate is expected to remain stable at 3.8%. US wage growth is expected to increase by 0.3% month-on-month, from 0.2% in September. With the September read surprising significantly to the upside, another robust US jobs number may likely add to concerns of high-for-longer inflation and call for the Fed to retain its hawkish messaging.
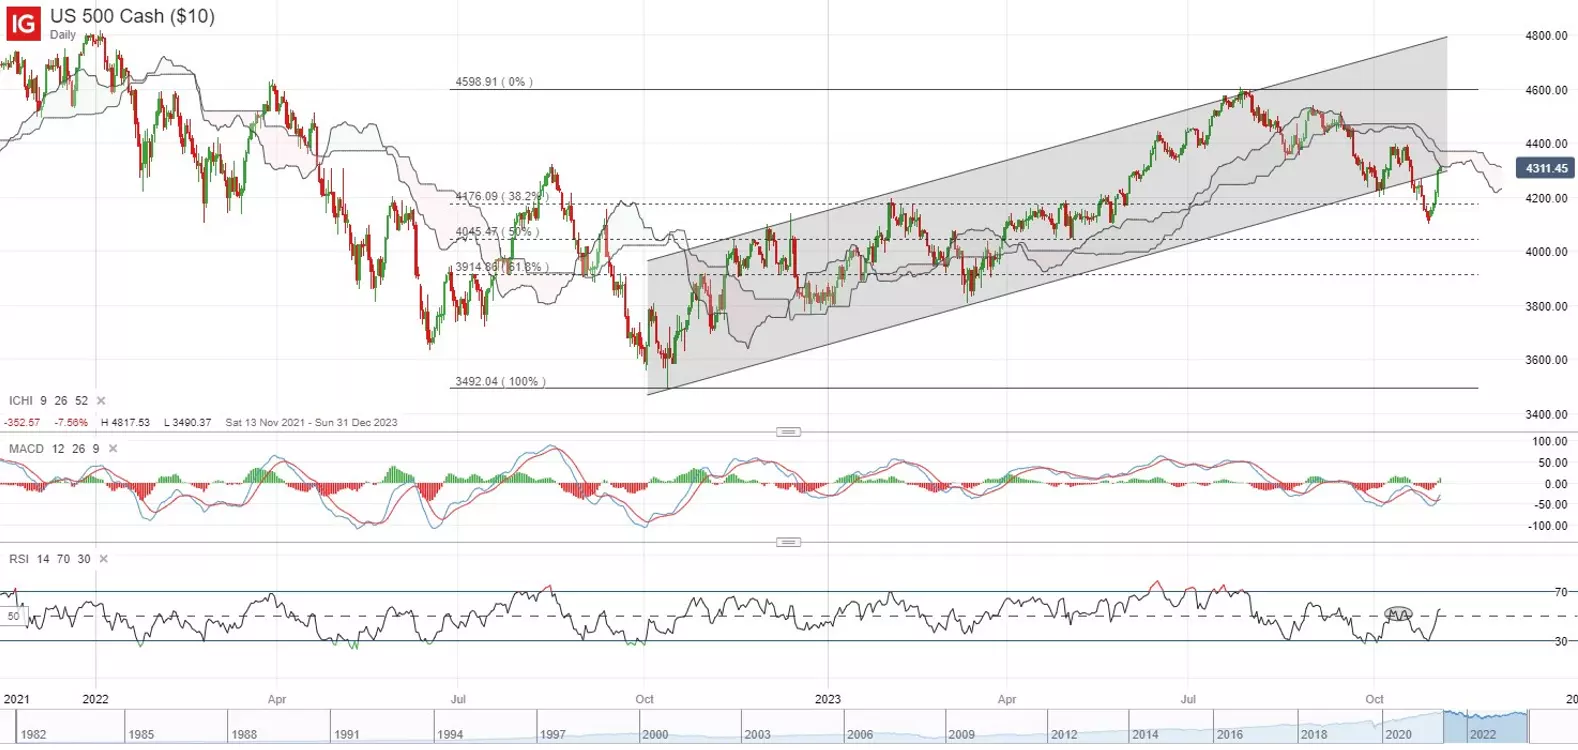
Having broken below a rising channel pattern in place since October 2022, recent recovery in the S&P 500 has managed to reclaim all of last week’s losses. The next resistance may stand at the 4,400 level, where the Ichimoku cloud resistance on the daily chart resides alongside its previous October tops. Overcoming this level may then potentially pave the way to retest its year-to-date high next.
Asia Open
Asian stocks look set for a positive open, with ASX +1.00%, NZX +0.82% and KOSPI +0.57% at the time of writing. Japan markets are closed for holiday. Chinese equities are also finding their way higher, with the Nasdaq Golden Dragon China Index up 2% overnight. Improving risk sentiments, lower bond yields and a weaker US dollar may provide catalysts for previous bearish sentiments to unwind.
The day ahead will leave China’s services Caixin Purchasing Managers' Index (PMI) readings in focus, with economic weakness likely to be the story, given the downside surprises in the recent official PMI data. Singapore’s retail sales data will be released as well. Apart from that, it may generally be a relatively quiet end to the week for the region, with all eyes on the upcoming US job report to set the tone into the new week.
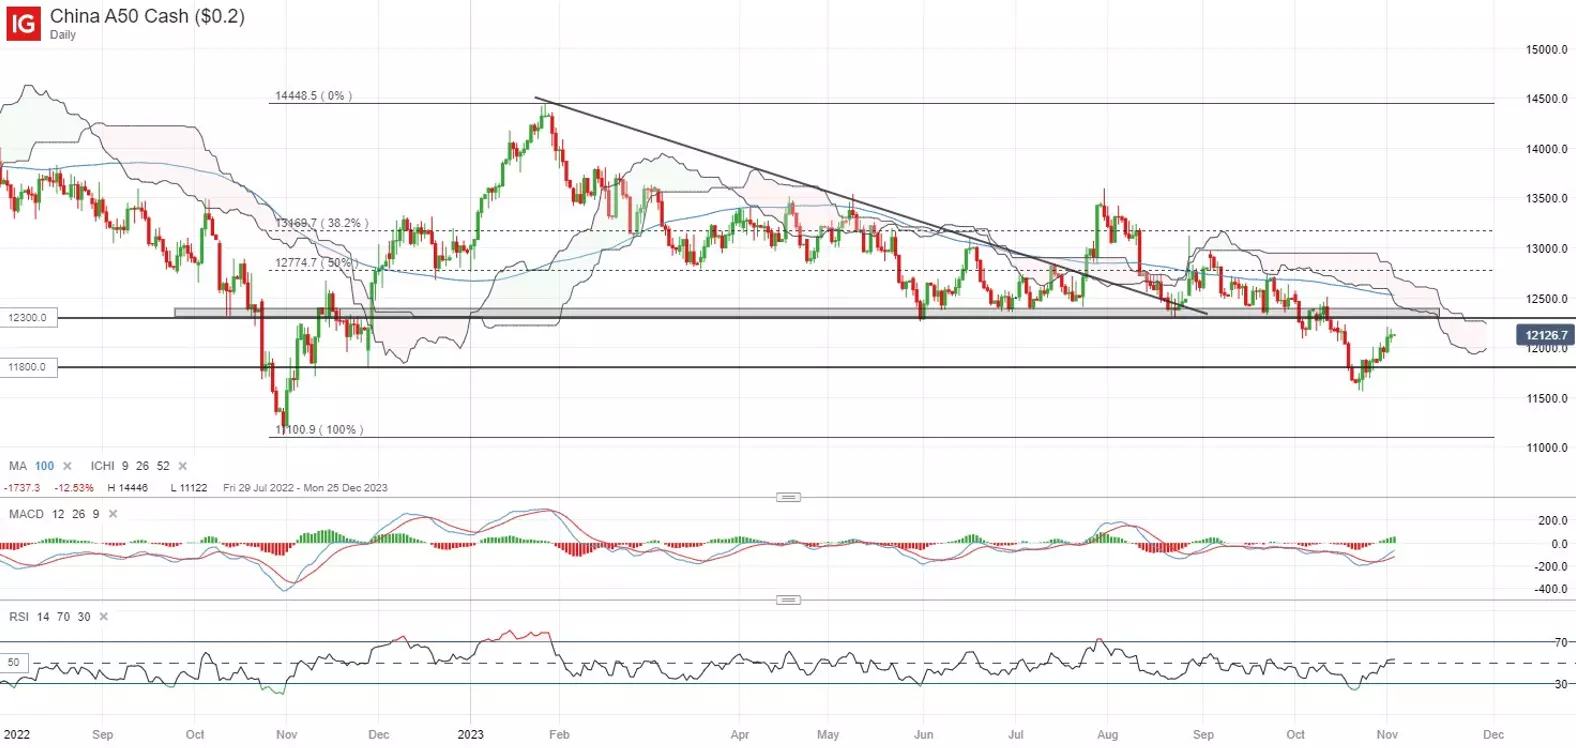
The China A50 continues to reveal a series of lower highs and lower lows as a sign of an ongoing downward trend. While there are some signs of life lately with a bullish crossover on Moving Average Convergence/Divergence (MACD), much still awaits with buyers potentially having to reclaim the 12,300 level to offer greater conviction. Longer-term, it may have to take a trend of improving economic data to sustain its gains, which has not been presented just yet.
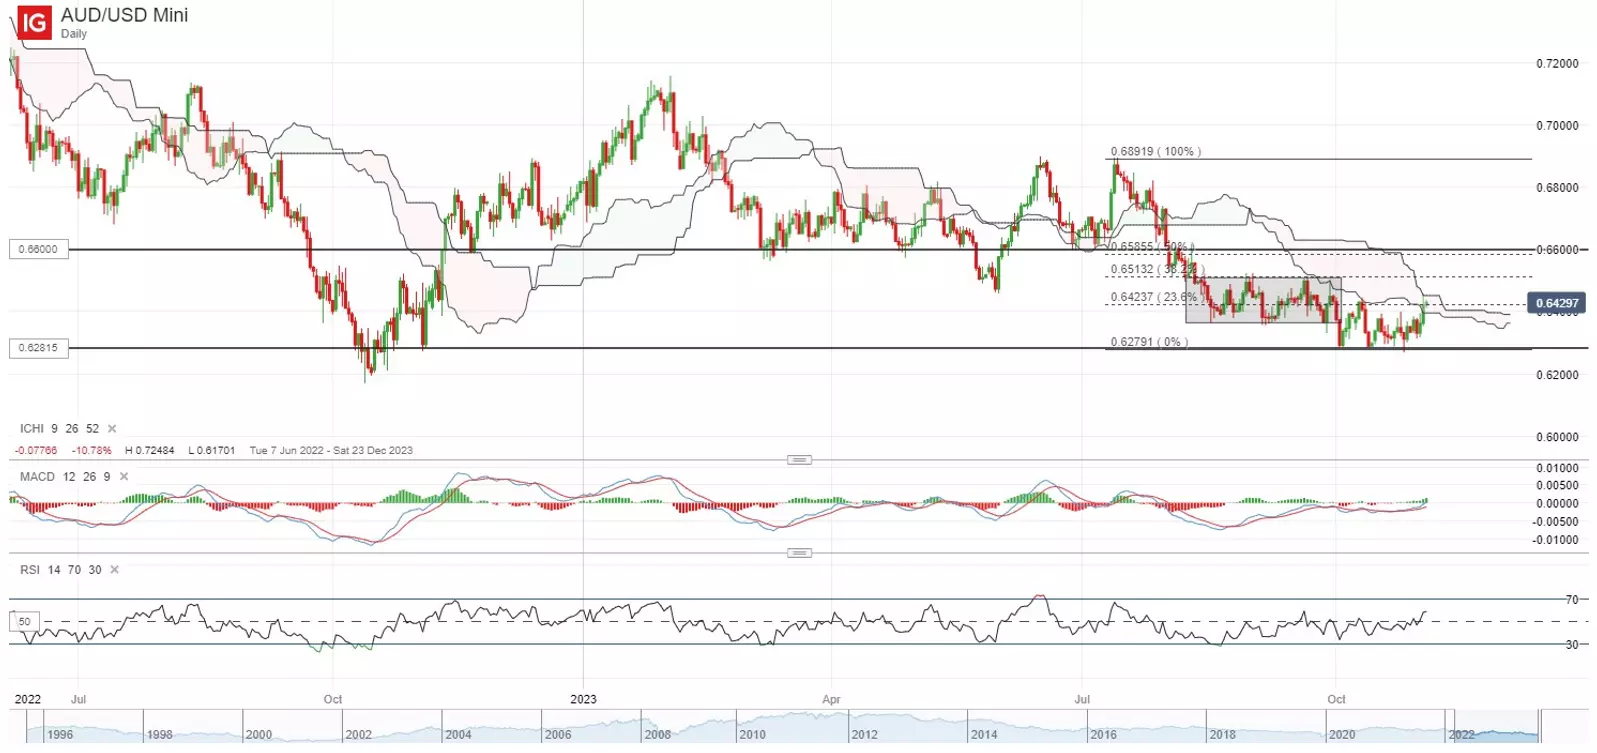
On the watchlist: AUD/USD retesting Ichimoku cloud resistance on improved risk sentiments
After being stuck in a range over the past month, the AUD/USD has managed to bounce off a key support at the 0.628 level upon multiple retests, with its daily Relative Strength Index (RSI) back to trade above the key 50 level as a reflection of buyers taking control. Nevertheless, several resistance may still have to be overcome ahead in order to provide greater conviction for the bulls, which will include its Ichimoku cloud on the daily chart, alongside the 0.651 level of resistance. Any successful attempt may likely leave the 0.660 level on watch next. On the downside, the 0.628 level has proven to be a key support level and any failure to defend this level may unlock fresh selling pressure towards the 0.600 level next.
Friday: DJIA +1.70%; S&P 500 +1.89%; Nasdaq +1.78%, DAX +1.48%, FTSE +1.42%
IGA, may distribute information/research produced by its respective foreign affiliates within the IG Group of companies pursuant to an arrangement under Regulation 32C of the Financial Advisers Regulations. Where the research is distributed in Singapore to a person who is not an Accredited Investor, Expert Investor or an Institutional Investor, IGA accepts legal responsibility for the contents of the report to such persons only to the extent required by law. Singapore recipients should contact IGA at 6390 5118 for matters arising from, or in connection with the information distributed.
The information/research herein is prepared by IG Asia Pte Ltd (IGA) and its foreign affiliated companies (collectively known as the IG Group) and is intended for general circulation only. It does not take into account the specific investment objectives, financial situation, or particular needs of any particular person. You should take into account your specific investment objectives, financial situation, and particular needs before making a commitment to trade, including seeking advice from an independent financial adviser regarding the suitability of the investment, under a separate engagement, as you deem fit.
No representation or warranty is given as to the accuracy or completeness of this information. Consequently, any person acting on it does so entirely at their own risk. Please see important Research Disclaimer.
Please also note that the information does not contain a record of our trading prices, or an offer of, or solicitation for, a transaction in any financial instrument. Any views and opinions expressed may be changed without an update.

Seize a share opportunity today
Go long or short on thousands of international stocks.
- Increase your market exposure with leverage
- Get spreads from just 0.1% on major global shares
- Trade CFDs straight into order books with direct market access
Live prices on most popular markets
- Forex
- Shares
- Indices
See more forex live prices
See more shares live prices
Prices above are subject to our website terms and agreements. Prices are indicative only. All shares prices are delayed by at least 15 mins.
See more indices live prices
Prices above are subject to our website terms and agreements. Prices are indicative only. All shares prices are delayed by at least 20 mins.
