Asia Day Ahead: RBA rate decision ahead, VIX hovers near year-to-date low
Today will leave the RBA's rate decision on watch, with focus on whether recent inflation progress is sufficient to soften the RBA’s hawkish stance.

Market Recap
With the US shut for Labour Day holiday, European indices were largely subdued overnight on some wait-and-see, failing to tap on gains in the earlier Asian session. European bond yields edged slightly higher, largely following through from last Friday’s moves. Despite the softer read in the recent US jobs report, the resilience in US Treasury yields to end last week seems to reflect some positioning for a high-for-longer rate outlook, potentially making provisions for upside risks to inflation ahead with higher oil prices and abating base effects.
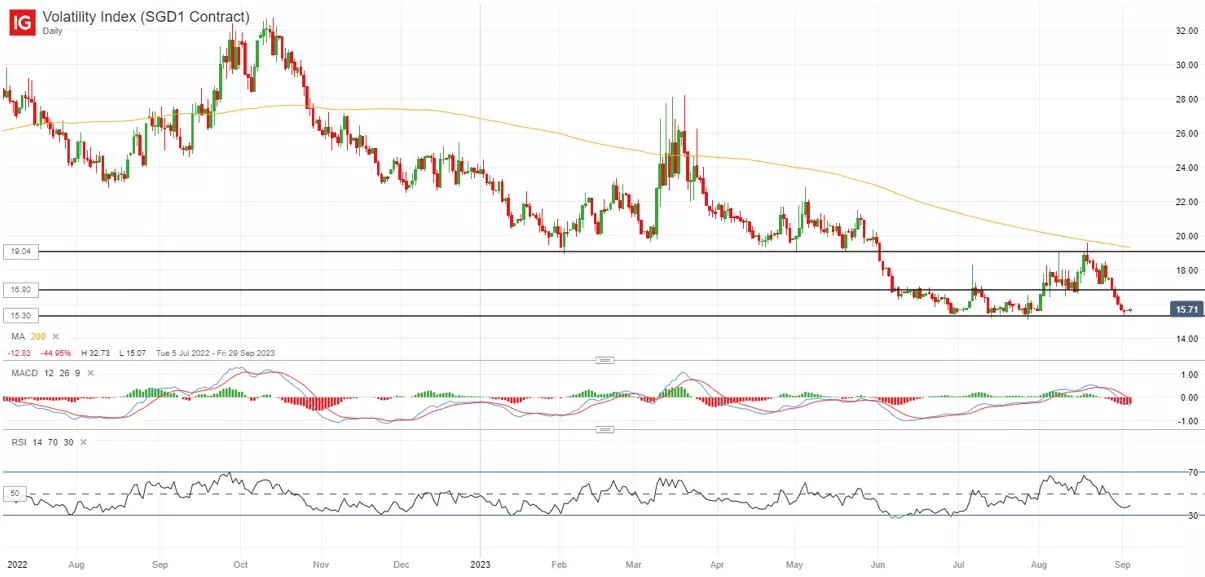
As the US markets return to trading today, clearer indications for the risk environment may be presented, with US equity futures just slightly underwater at the time of writing. Perhaps one to watch ahead may be the Volatility Index (VIX), which has recently declined for six straight days to hover near its year-to-date low at the 15.30 level.
Current VIX levels still point towards a general risk-on environment, but given its negative correlation with the stock market, any attempt to bounce from its immediate horizontal support could translate to near-term downside pressure for US indices. On the other hand, a break to a new year-to-low could indicate abating stress for markets, with any move below the 15.30 level potentially paving the way to retest its 2018 low at the 13.50 level next.
Asia Open
Asian stocks look set for a downbeat open, with Nikkei -0.12%, ASX -0.57% and KOSPI -0.26% at the time of writing. Recent property support measures have brought a relief rally for Chinese equities in yesterday’s session, with the Hang Seng Index up 2.5%. But as with the series of support measures that we have seen so far, whether gains can be sustained will still depend on the degree of policy success in translating to a turnaround in economic conditions ahead.
Today will leave the Reserve Bank of Australia (RBA) interest rate decision on the radar. Recent downside surprise in Australia’s inflation and weaker purchasing managers index (PMI) data have offered room for the central bank to keep rates on hold at the upcoming meeting, which is also the wide market consensus.
The focus instead may be on whether recent progress in inflation is sufficient to soften the RBA’s hawkish stance, given that there are still some hawkish bets in place that the RBA may have to tighten by another 25 basis-point (bp) by the end of this year.
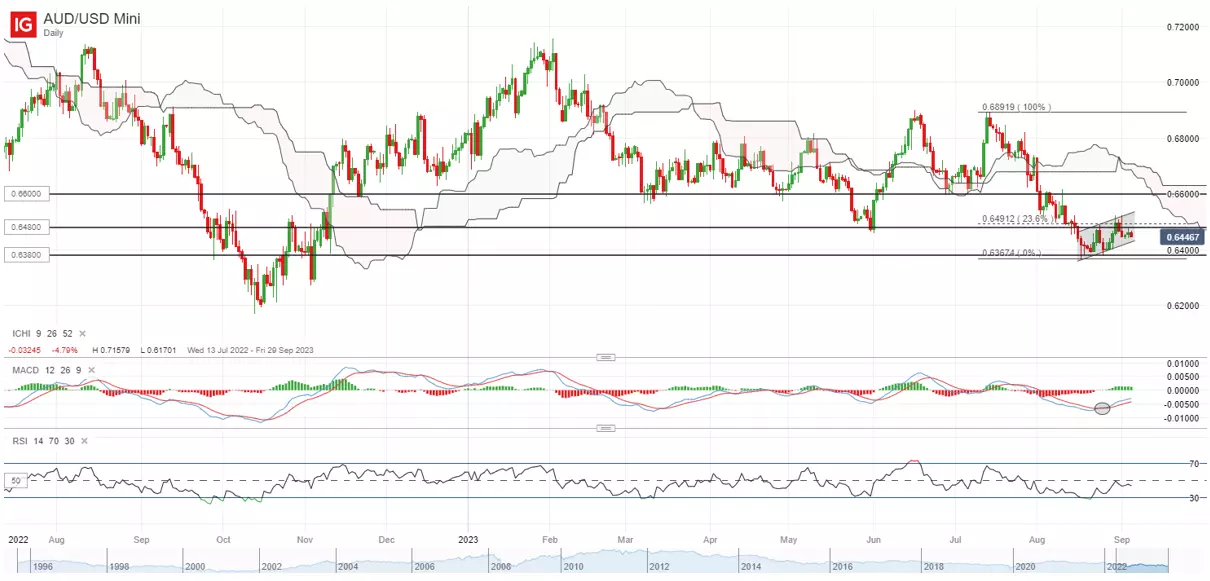
The AUD/USD has attempted to recover last week alongside the broader risk environment, but much may still await for now, having just reached the 23.6% Fibonacci level of retracement from its July peak to August 2023 bottom. While a bullish crossover on moving average convergence/divergence (MACD) was presented in the daily chart, the risks of a bearish flag formation remain, with a retest of the 0.650 level last Friday met with a bearish rejection. Any breakdown of the upward-sloping consolidation channel may pave the way for a continuation of the downward trend, while on the upside, the last Friday’s high may have to be overcome to signal buyers in greater control.
On the watchlist: GBP/USD struggling to bounce off head-and-shoulder neckline for now
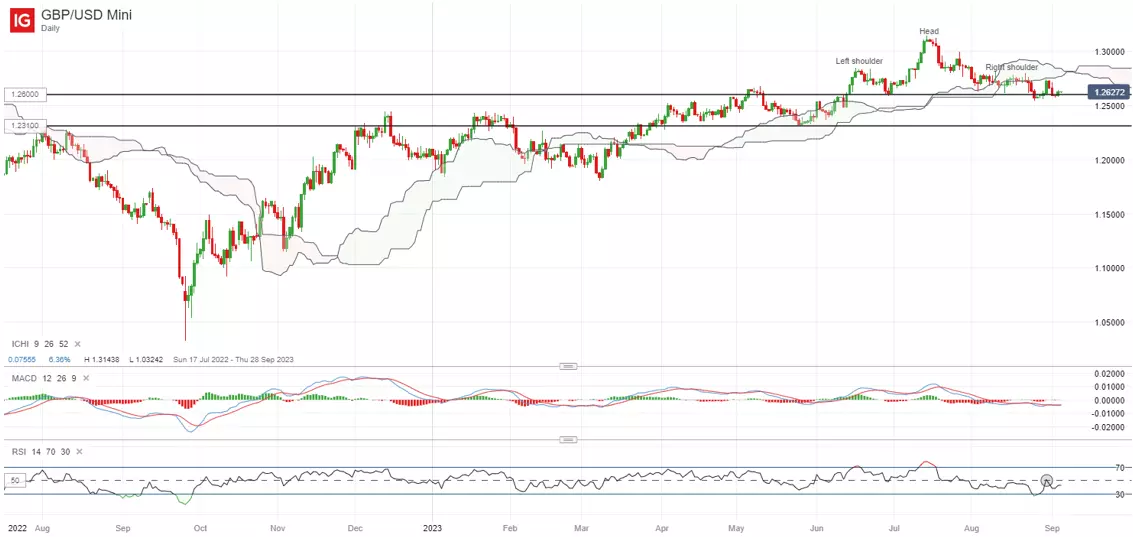
Having traded within a head-and-shoulder formation on the daily chart since June this year, recent attempt to bounce off the neckline at the 1.260 level has failed to find much follow-through amid strength in the US dollar to end last week.
On the daily chart, the relative strength index (RSI) has struggled to cross back above the key 50 level over the past month, while the pair seems to be finding some resistance at the lower edge of its Ichimoku cloud pattern after a breakdown in late-August. The head-and-shoulder neckline at the 1.260 level is put to the test once again this week, with any failure to defend the level potentially paving the way towards the 1.231 level.
Monday: US markets closed for holidays, DAX -0.10%, FTSE -0.16%
IGA, may distribute information/research produced by its respective foreign affiliates within the IG Group of companies pursuant to an arrangement under Regulation 32C of the Financial Advisers Regulations. Where the research is distributed in Singapore to a person who is not an Accredited Investor, Expert Investor or an Institutional Investor, IGA accepts legal responsibility for the contents of the report to such persons only to the extent required by law. Singapore recipients should contact IGA at 6390 5118 for matters arising from, or in connection with the information distributed.
The information/research herein is prepared by IG Asia Pte Ltd (IGA) and its foreign affiliated companies (collectively known as the IG Group) and is intended for general circulation only. It does not take into account the specific investment objectives, financial situation, or particular needs of any particular person. You should take into account your specific investment objectives, financial situation, and particular needs before making a commitment to trade, including seeking advice from an independent financial adviser regarding the suitability of the investment, under a separate engagement, as you deem fit.
No representation or warranty is given as to the accuracy or completeness of this information. Consequently, any person acting on it does so entirely at their own risk. Please see important Research Disclaimer.
Please also note that the information does not contain a record of our trading prices, or an offer of, or solicitation for, a transaction in any financial instrument. Any views and opinions expressed may be changed without an update.

Seize a share opportunity today
Go long or short on thousands of international stocks.
- Increase your market exposure with leverage
- Get spreads from just 0.1% on major global shares
- Trade CFDs straight into order books with direct market access
Live prices on most popular markets
- Forex
- Shares
- Indices
See more forex live prices
See more shares live prices
Prices above are subject to our website terms and agreements. Prices are indicative only. All shares prices are delayed by at least 15 mins.
See more indices live prices
Prices above are subject to our website terms and agreements. Prices are indicative only. All shares prices are delayed by at least 20 mins.
