Asia Day Ahead: AUD/USD higher on Australia’s inflation, while traders digest mixed US big tech results
Further softening in the US 10-year Treasury yields overnight provided room for Wall Street to continue its recovery this week, while focus revolved around the mixed big tech results after-market.


Market Recap
Further softening in the US 10-year Treasury yields overnight provided room for Wall Street to continue its recovery this week (DJIA +0.62%;S&P 500 +0.73%;Nasdaq +0.93%), while the US earnings season thus far has also kept up with its outperformance momentum. Out of the 25% of S&P 500 companies which have released their results, 82% have beaten earnings expectations. This rate of outperformance is above the 5-year average of 77% and 10-year average of 74%.
On the economic calendar, more lukewarm figures from the US flash Purchasing Managers' Index (PMI) data likely add to soft-landing hopes for now, although the data did not drive much sustained market moves. The takeaway is that US economic conditions have stabilised in October after months of decline, as US services PMI turned higher for the first time in five months while the manufacturing sector halted its contractionary trend.
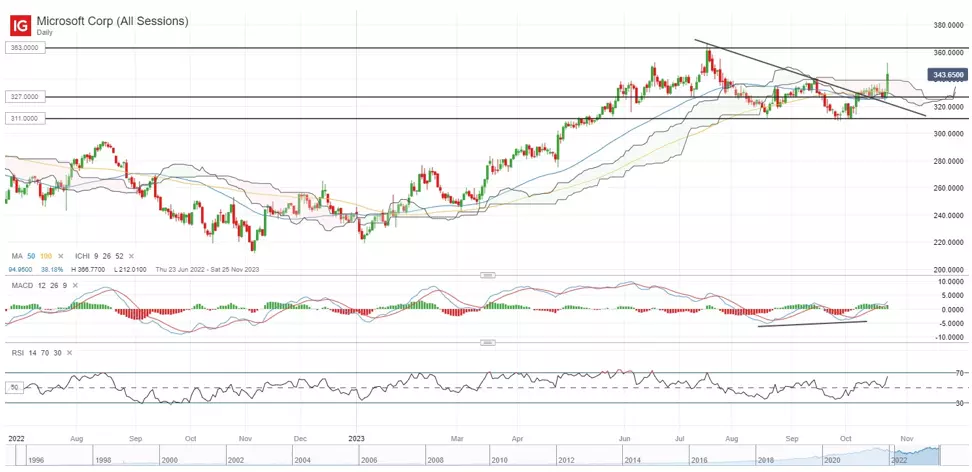
Nevertheless, more focus will revolve around the mixed showing in after-market results from Microsoft's and Alphabet's earnings. For Microsoft, a significant top and bottom-line beat, quicker-than-expected growth in its cloud segment (29% versus 26% consensus) and above-target forecasts supported a 4% gain in share price after-market. On the other hand, Google cloud revenue disappointed with a below-forecast read, with its fourth straight quarter of softening growth failing to convince investors of its competitive edge in its cloud services against other big tech peers. Its share price is down 6% after-market.
If the after-market gain in Microsoft’s share price is sustained tonight, it will mark an upward break of its Ichimoku cloud resistance on the daily chart for the first time since August 2023. Its weekly Relative Strength Index (RSI) has also defended its key 50 level lately, which may support an upward trend in place. Further upside may leave its all-time high at the US$363.00 level on watch for a retest, while crucial support to hold will be at the US$327.00 level.
Asia Open
Asian stocks look set for a mixed open, with Nikkei +1.21%,ASX -0.13% and KOSPI -0.24% at the time of writing. Softening US yields, falling oil prices and a positive handover from Wall Street may be bullish catalysts for the region, but gains seem conflicted as investors continue to digest the mixed US big tech results after-market, along with a strong upmove in the US dollar overnight.
The economic calendar this morning saw higher-than-expected Australia’s inflation numbers across the board, with its 3Q headline inflation rising 5.4% versus the 5.35 forecast. The closely-watched Reserve Bank of Australia (RBA) trimmed mean Consumer Price Index (CPI) also rose 5.2% year-on-year, higher than the 5% forecast, while its monthly CPI indicator rose 5.6% in September, above the expected 5.4%. The more persistent showing in inflation has given rise to some hawkish bets for additional rate hike, especially with earlier guidance from the hawkish RBA minutes in October that “further tightening of policy may be required should inflation prove more persistent than expected.”
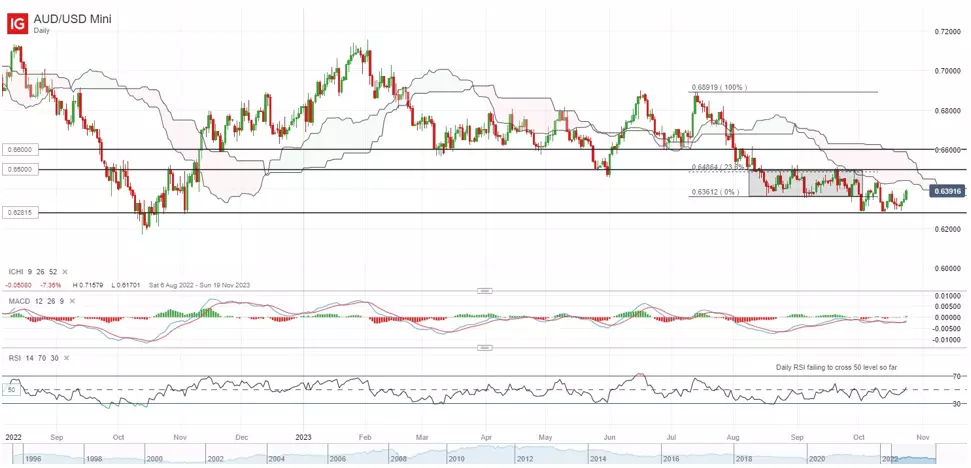
The AUD/USD has found its way higher in today’s session after finding support from its horizontal support at the 0.628 level, while its daily RSI is also attempting for another cross above the 50 level. That said, its looming daily Ichimoku cloud zone on further upside may likely be a strong area of resistance to overcome and conviction for more sustained upmoves may still warrant an upward break of the 0.650 level.
On the watchlist: Copper prices attempting to hold key support
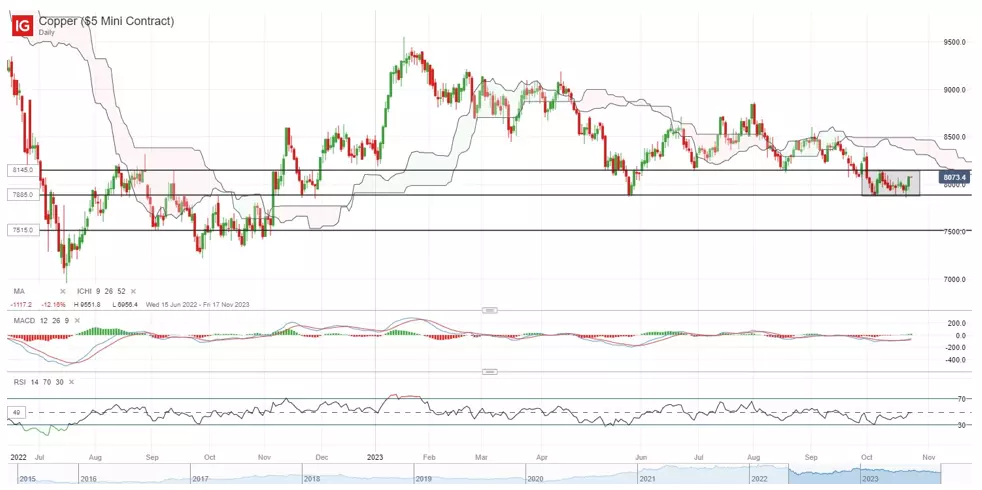
After falling more than 10% since August this year, copper prices have been consolidating above a key horizontal support at the $7,885/tonne level lately as an attempt to stabilise. Near-term conviction for the bulls may come from a move above its October 2022 high at the $8,145/tonne level, along with a reversion in its daily RSI back above the 50 level, which prices have failed to do so over the past month. That may potentially support a move to retest the $8,500/tonne level next, where the daily Ichimoku cloud resistance stands. On the other hand, failure for the $7,885/tonne level to hold may reinforce sellers in control and likely to leave the $7,515/tonne level in sight next.
Tuesday: DJIA +0.62%; S&P 500 +0.73%; Nasdaq +0.93%, DAX +0.54%, FTSE +0.20%
IGA, may distribute information/research produced by its respective foreign affiliates within the IG Group of companies pursuant to an arrangement under Regulation 32C of the Financial Advisers Regulations. Where the research is distributed in Singapore to a person who is not an Accredited Investor, Expert Investor or an Institutional Investor, IGA accepts legal responsibility for the contents of the report to such persons only to the extent required by law. Singapore recipients should contact IGA at 6390 5118 for matters arising from, or in connection with the information distributed.
The information/research herein is prepared by IG Asia Pte Ltd (IGA) and its foreign affiliated companies (collectively known as the IG Group) and is intended for general circulation only. It does not take into account the specific investment objectives, financial situation, or particular needs of any particular person. You should take into account your specific investment objectives, financial situation, and particular needs before making a commitment to trade, including seeking advice from an independent financial adviser regarding the suitability of the investment, under a separate engagement, as you deem fit.
No representation or warranty is given as to the accuracy or completeness of this information. Consequently, any person acting on it does so entirely at their own risk. Please see important Research Disclaimer.
Please also note that the information does not contain a record of our trading prices, or an offer of, or solicitation for, a transaction in any financial instrument. Any views and opinions expressed may be changed without an update.

Seize a share opportunity today
Go long or short on thousands of international stocks.
- Increase your market exposure with leverage
- Get spreads from just 0.1% on major global shares
- Trade CFDs straight into order books with direct market access
Live prices on most popular markets
- Forex
- Shares
- Indices
See more forex live prices
See more shares live prices
Prices above are subject to our website terms and agreements. Prices are indicative only. All shares prices are delayed by at least 15 mins.
See more indices live prices
Prices above are subject to our website terms and agreements. Prices are indicative only. All shares prices are delayed by at least 20 mins.
