EUR/USD, GBP/USD and AUD/USD bullish ahead of US inflation print
Outlook on EUR/USD, GBP/USD and AUD/USD ahead of US CPI and PPI data releases.


EUR/USD rises ahead of US inflation print
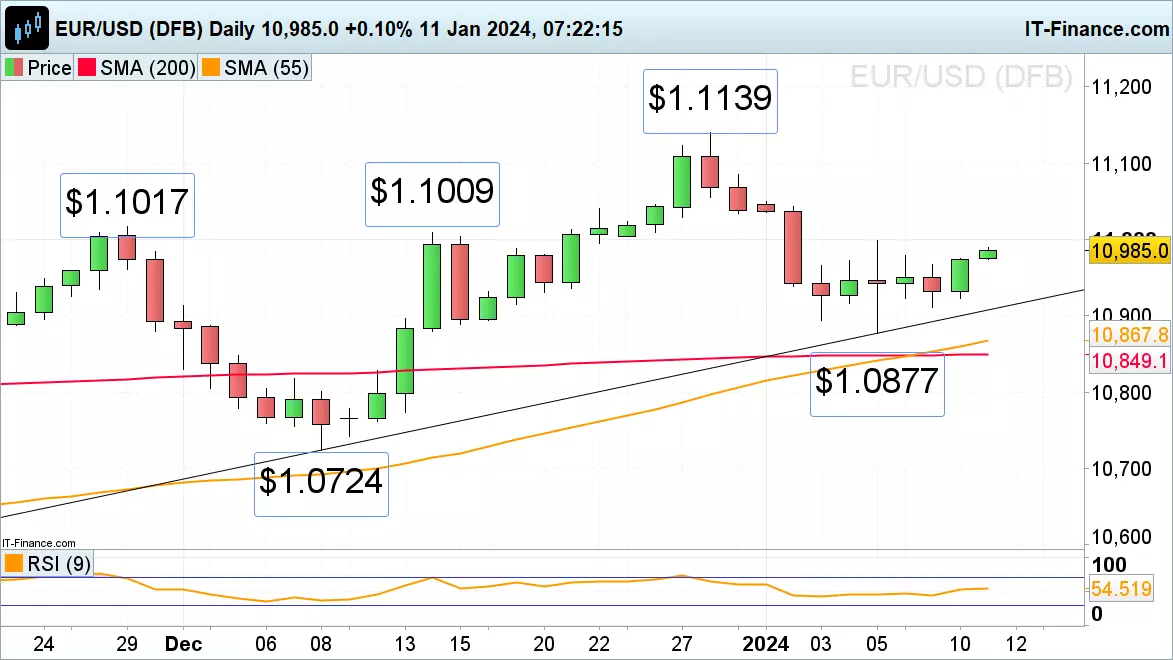
EUR/USD’s bullish reversal off last week’s low at $1.0877 post US Non-Farm Payrolls seems to have legs with last week’s high at $1.0998 now being within reach ahead of today’s US Consumer Price Index (CPI) release. The rise in the cross seems to be attributed to US dollar weakness rather than euro strength as the eurozone faces a possible recession as it had a slight slowdown in third quarter (Q3) and indicators point towards a potential contraction in December.
Above $1.0998 lie the November and mid-December highs at $1.1009 to $1.1017 which are likely to act as resistance.
Minor support can be spotted around the 2 January low at $1.0939 with further minor support being seen at last Thursday’s $1.0916 low ahead of the recent $1.0894 to $1.0877 lows.
GBP/USD probes minor resistance
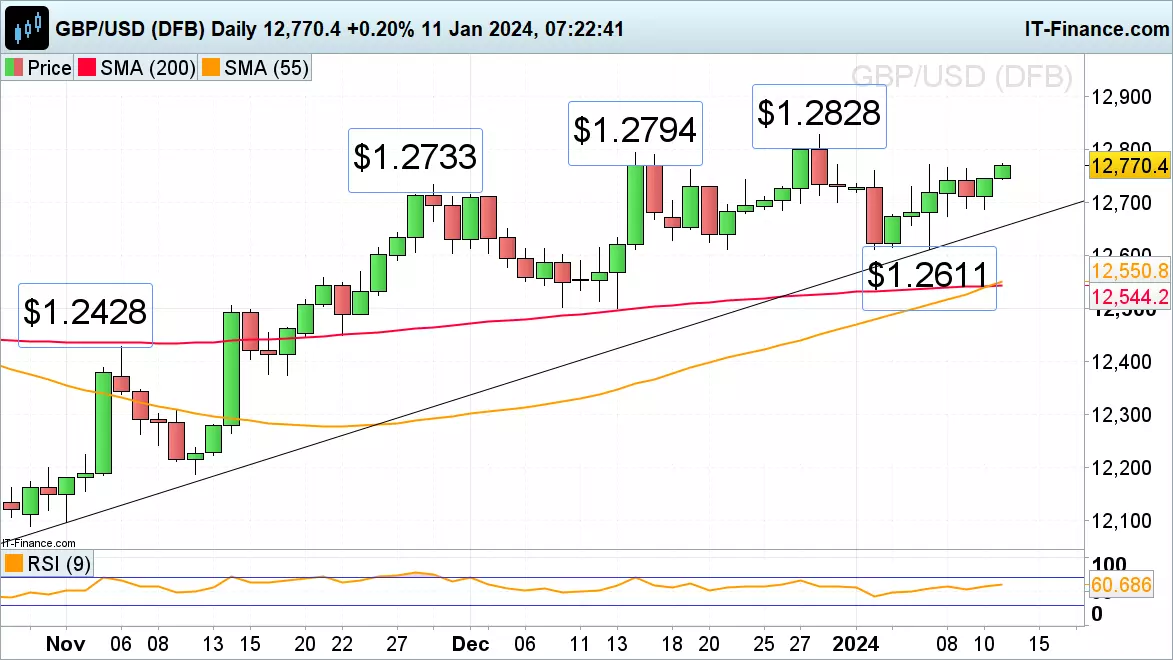
GBP/USD’s bullish reversal from its two-week low at $1.2611, seen last week amid the publication of US Non-Farm Payrolls, has taken it to last week’s $1.2771 high.
Above this level beckon the mid-December high at $1.2794 and the December five-month peak at $1.2828.
Upside pressure should dominate while Wednesday’s low at $1.2687 underpins. Above it minor support can be found at Wednesday’s $1.2745 high and below it lie the November-to-January uptrend line, 21 December and current January lows at $1.2656 to $1.2611.
AUD/USD continues to range trade above last week’s low
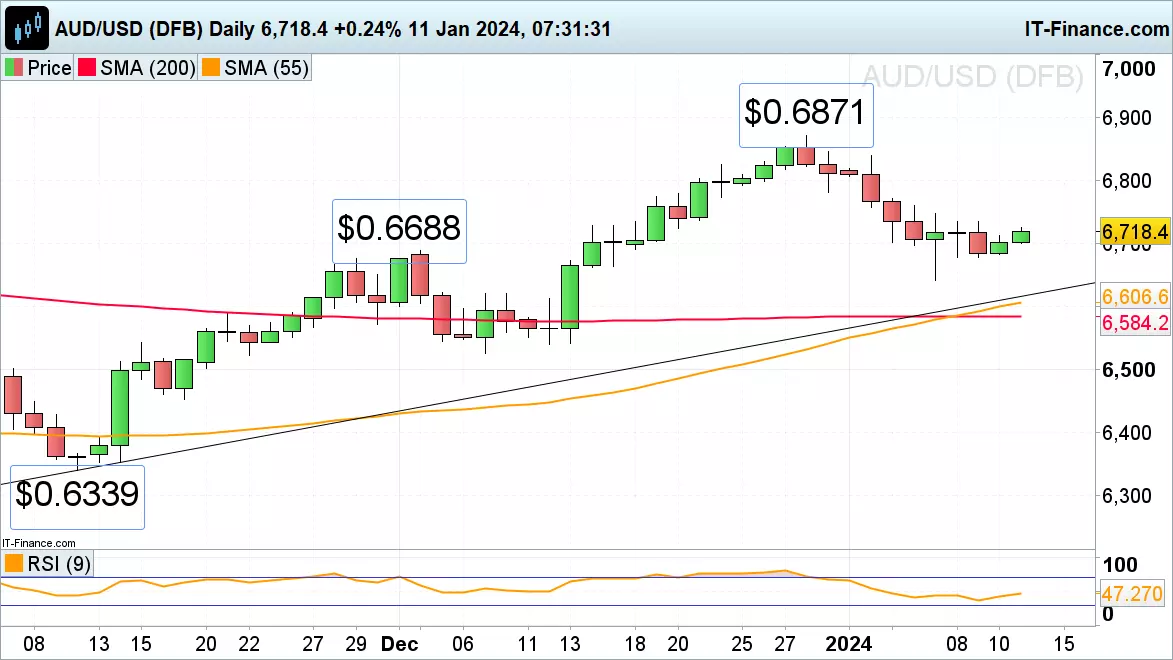
AUD/USD’s slide from its five-month December peak at $0.6871 to last week’s $0.6641 low amid a falling gold price has been followed by sideways trading despite Australia’s trade surplus beating estimates.
Minor resistance sits at Monday’s $0.6734 high, above which lies at Friday’s $0.6748 high which needs to be exceeded for at least a minor bullish reversal to become possible.
While $0.6748 isn’t overcome, overall downside pressure is likely to retain the upper hand with a fall through $0.6641 possibly leading to the October-to-January uptrend line and the 200- and 55-day simple moving averages (SMA) at $0.6616 to $0.6584 being reached.
IGA, may distribute information/research produced by its respective foreign affiliates within the IG Group of companies pursuant to an arrangement under Regulation 32C of the Financial Advisers Regulations. Where the research is distributed in Singapore to a person who is not an Accredited Investor, Expert Investor or an Institutional Investor, IGA accepts legal responsibility for the contents of the report to such persons only to the extent required by law. Singapore recipients should contact IGA at 6390 5118 for matters arising from, or in connection with the information distributed.
The information/research herein is prepared by IG Asia Pte Ltd (IGA) and its foreign affiliated companies (collectively known as the IG Group) and is intended for general circulation only. It does not take into account the specific investment objectives, financial situation, or particular needs of any particular person. You should take into account your specific investment objectives, financial situation, and particular needs before making a commitment to trade, including seeking advice from an independent financial adviser regarding the suitability of the investment, under a separate engagement, as you deem fit.
No representation or warranty is given as to the accuracy or completeness of this information. Consequently, any person acting on it does so entirely at their own risk. Please see important Research Disclaimer.
Please also note that the information does not contain a record of our trading prices, or an offer of, or solicitation for, a transaction in any financial instrument. Any views and opinions expressed may be changed without an update.

Start trading forex today
Trade the largest and most volatile financial market in the world.
- Spreads start at just 0.6 points on EUR/USD
- Analyse market movements with our essential selection of charts
- Speculate from a range of platforms, including on mobile
Live prices on most popular markets
- Forex
- Shares
- Indices
See more forex live prices
See more shares live prices
Prices above are subject to our website terms and agreements. Prices are indicative only. All shares prices are delayed by at least 15 mins.
See more indices live prices
Prices above are subject to our website terms and agreements. Prices are indicative only. All shares prices are delayed by at least 20 mins.
