Channel trading explained
Channel trading can enable a trader to track and speculate on the prevailing market trend. Here, we explain how to identify trading channels, the different types of trading channel, and some popular channel trading indicators.

What is channel trading?
Channel trading involves using technical indicators which highlight areas of support and resistance. Traders can use this information to assess whether they should open a buy or sell position, as well as to determine current market volatility levels.
For reference, support and resistance are separate levels which appear to restrict an asset’s price movements. Support is the level at which an asset’s price might stop falling, and resistance is the level at which an asset’s price might stop rising.
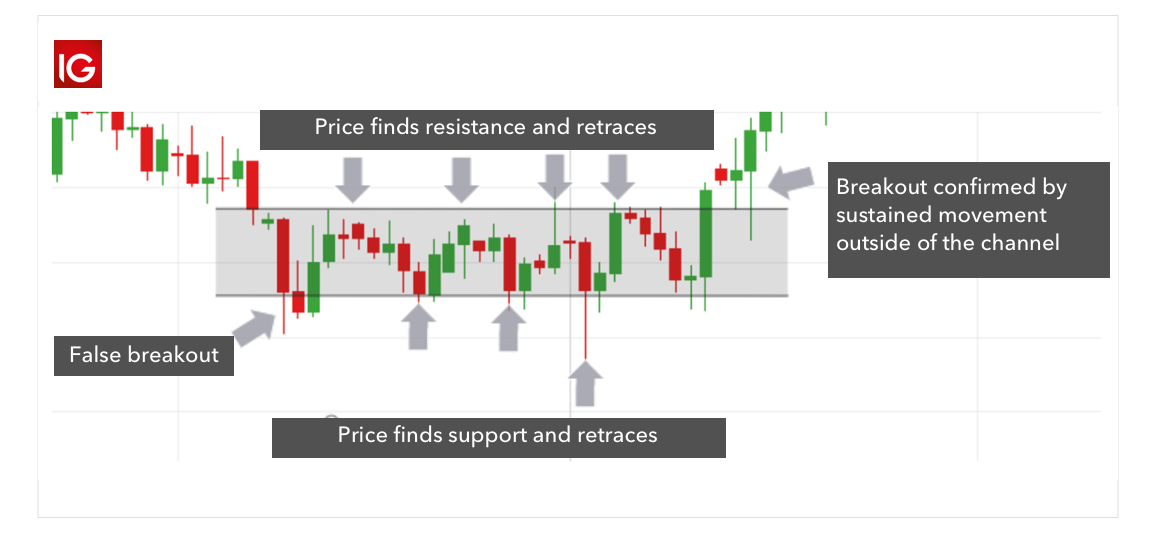
In channel trading, a trader would open a long position when an asset’s price finds support, and they would open a short position when the price finds resistance. This is on the assumption that an asset’s price will retrace when it reaches either support or resistance.
This will only prove true if the price does not break through to close below support or above resistance. If it does, it could be indicative of a strengthening trend – so traders will want to open a position which complements the trend. They would do this by going long if the price is continuing to rise through resistance, or by going short if it is continuing to fall through support.
Before trading a breakout, it is often sensible to wait until it is confirmed by the price closing outside of the boundaries of the channel at least two consecutive times. Equally, many traders do not consider a channel to be confirmed until an asset’s price has reached support or resistance and retraced at least two to three times.
How to trade using channels
There are two ways to trade using channels – either by trading the trend or trading the breakout once the trend has completed. Trading the trend will involve taking a position consistent with the overall direction of the trend, such as going long in an ascending channel and going short in a descending channel.
However, you can also take a position in the opposite direction to a trend during a temporary retracement, which could eventually turn into a more permanent reversal. If this is the case, you will want to have entered the trend at an early stage, such as when the price first hits support or resistance, in order to benefit from any long-term change in price against the prevailing trend.
Trading the breakout will mean that you take a position on any price action which breaks through the upper or lower band of the channel. For example, you could take a long position if the price of an asset breaks above the upper band of a channel, and you could take a short position if the price falls below the lower band.
Learn about some price action trading strategies
Traders can use financial derivatives such as CFDs and spread bets to trade using channels. This is because these products enable you to go long as well as short, meaning that you can use them in all types of channel.
Types of channel
Broadly speaking, there are four types of trading channel: ascending channels, descending channels, flat channels and enveloping channels.
Ascending channels
Ascending channels indicate that the current market trend is bullish, because an asset’s price is experiencing an overall increase of higher highs and higher lows. However, while an ascending channel is bullish, traders can also go short if the price hits resistance and retraces back rather than breaking through. The intention can be to profit outright from the short position, or to hedge their long position in the channel against a temporary decrease in price.
Traders will open long positions when the price reaches support, to profit from the overall increase in price. This is generally gradual, but you can use channels in a variety of different timeframes, including by the minute, the hour, the day or the month.
Traders consider an ascending channel as complete once the price has closed above resistance or below support. In the case of the asset’s price rising above resistance, a trader will likely keep their long position open. However, in the case of the asset’s price closing below support, the trader will likely open a short position – or keep their current one if they had opened it during what they thought at the time was a retracement.

Descending channels
Descending channels indicate that the current trend is bearish, because the underlying market price will be in an overall downtrend. The price graph below shows a descending channel, and you can see that the channel is characterised by a series of lower highs and lower lows.
Traders will go short during a descending channel, either to profit from the downward market movement, or to hedge any long positions they might have in the same market. However, once the channel is completed and the price of the underlying begins to increase, a trader will likely open a long position to profit from any increases in price.

As the price chart above shows, the price on the far right of the channel closed above the level of resistance, which was an early indicator that the overall downward trend was complete. At this point, traders would likely close any remaining short positions they had open and take long positions on the underlying, with the assumption that the descending channel was complete and the asset’s price could be about to experience an overall upward trend.
Horizontal channels
Horizontal channels indicate that, for the time being, an asset’s price is trading within a narrow or consistent band, characterised by equal highs and equal lows. Typically, traders use horizontal channels to confirm a sideways trend, and they do this by identifying two to three points of contact between both support and resistance within the same overall sideways movement.
Traders will tend to go both long and short in equal measure during a horizontal channel, opting for long when the price hits support, and short when the price touches resistance. They would do this on the assumption that the price will retrace after reaching these levels – so long as it breaks out and closes above or below.
Horizontal channels are different to their ascending and descending counterparts because, within a horizontal channel, many traders believe that the price is more likely to retrace from support and resistance once it has reached those levels, rather than breakout.
However, the price doesn’t always retrace back from the upper and lower bands of a channel, and so it is important to take necessary steps to manage your risk in case a breakout occurs.
Learn more about risk management
Enveloping channels
Enveloping channels include many different types of volatility indicators – including Bollinger bands and Keltner channels. They get their name from the way they look, because an enveloping channel will have two lines – usually a standard deviation or average true range – set either side and ‘enveloping’ a central line, which is usually some form of moving average.
Enveloping channels are different to the three variations previously mentioned, because they react to price action dynamically, rather than being two set parallel lines. For example, if an enveloping channel is based on a set number of standard deviations away or toward the central moving average, it will widen and narrow when volatility levels increase or decrease.
Traders will enter buy or sell orders depending on which band the price of an asset is currently touching or if it has broken through. For example, if an asset has breached the upper band, many traders will enter a buy order on the expectation that the price will continue to rise. However, if the price of an asset has fallen below the lower band, traders will usually open a short position on the expectation that the price will continue to fall.
Five popular trading channel indicators
There are a range of trading channel indicators that you can incorporate as part of your trading strategy. Many of the channel indicators denote volatility levels, and they can be useful for triggering buy or sell signals based on current volatility in an underlying market. The levels at which you can buy or sell will depend on your appetite for risk, and what the indicator is showing you.
Because no one trading channel indicator can do everything, we recommend that you use at least two to three of the indicators explained in this list to greater confirm a market movement before opening or closing a position. With that said, five popular trading channels are:
Donchian channel
Donchian channels show the difference between an asset’s current price and its previous trading ranges. This information can help to determine volatility and potential breakouts, retracements or reversals in an underlying market. Donchian channels use three bands, with the upper and lower bands based on the highest high and the lowest low for a given period, and the middle band being an average of the two.
Traders will usually use a 20-day period as the basis of a Donchian channel, and the width of the channel denotes how volatile an underlying market is. If the bands are narrow, the underlying market is stable but if the bands are wide, the underlying market is considered to be experiencing increased volatility.
Traders will usually open a long position if an asset’s price breaks above the upper band, and they will enter a short position if the asset’s price falls below the lower band. This is because if the asset’s price rises above the upper band, it indicates a possible series of higher highs, and if the asset’s price falls below the lower band, it indicates a possible series of lower lows.
The configuration of Donchian channels gives them a sharper look when compared to the smoother appearance of both Bollinger bands and Keltner channels, as will become evident in later sections of this article. The chart below gives an example of what a Donchian channel looks like when overlaid against an asset’s price movements.

Bollinger bands
Bollinger bands are a volatility indicator, used by traders to identify areas of support and resistance and areas in which an asset might be experiencing increased or decreased volatility. Bollinger bands are calculated from three lines drawn onto a price chart.
The first is the simple moving average (SMA) of an asset’s price over a given period – usually 20 days. The upper band is the SMA plus two standard deviations which have been multiplied by two, while the lower band is the SMA minus two standard deviations which have been multiplied by two.
The exact method for calculating the different Bollinger bands is as follows:
- The upper band = 20-day SMA + (20-day standard deviation multiplied by 2)
- The lower band = 20-day SMA - (20-day standard deviation multiplied by 2)
- The SMA is calculated by adding up the closing prices in a set period and dividing that number by the total number of periods
Many traders use Bollinger bands to indicate areas of market volatility – and they assume that the more the bands deviate from the SMA, the more volatile the underlying market. In contrast, if the bands are narrow then many traders take this to show that the underlying market price is stable.
When the bands widen, traders refer to it as a Bollinger bounce and believe that it is indicative of an upcoming retracement. Narrowing bands are known as a Bollinger squeeze and this is taken to indicate an upcoming breakout in the underlying asset.
Bollinger bands are a lagging indicator, which some consider to be a drawback. This means that they seek to confirm trends rather than predict future market movements. Indicators which seek to predict future market movements are known as leading indicators, and these include the relative strength index (RSI) or the stochastic oscillator.
However, lagging indicators such as Bollinger bands can be used to confirm a trend before entering a position, although this is most effectively done in conjunction with other technical indicators. This means that a trader might miss out on the start of a trend, but they still stand to profit once they have used a lagging indicator, or a collection of lagging indicators, to confirm the trend.

Keltner channel
Keltner channels are similar to both Bollinger bands and Donchian channels in that they show price volatility in an underlying asset. However, Keltner channels differ from the two because Keltner uses an exponential moving average (EMA) as the centre line, with an average true range (ATR) of previous price action in the underlying market set either side of it. Traders believe that if the asset’s price closes above the upper band or below the lower band, it could be a sign that there will be a change in the prevailing trend, or a trend acceleration.
Learn more about the average true range indicator
Because it is based on an exponential moving average and the average true range, the Keltner channel indicator filters out unnecessary information about minor price action. As a result, some traders believe that the Keltner channel creates a more accurate representation of an asset’s overall volatility in a given period of time when compared to other trading channel indicators on this list.
In the example price graph below, the bar on the far left has broken above the upper band of the Keltner channel, which would trigger a buy signal for many traders. If they had done so, they would be in profit, because the price of the underlying continued to rise.
Equally, when this trend starts to slow down and retrace, the price of the asset drops back into the Keltner channel before it breaks through resistance, which signals a more permanent reversal. This would be a perfect opportunity for a trader to go short on the underlying.

Fibonacci channels
Fibonacci channels are a technical indicator based on Fibonacci retracements and the Fibonacci sequence of numbers. In the sequence, each number is the sum of the two previous numbers – for example 0, 1, 1, 2, 3, 5, 8, 13, 21, 34, 55, 89, 144, and so on. Traditionally, the Fibonacci sequence is significant in price action and chart analysis, with many traders believing that the ratios derived from the Fibonacci sequence can show areas of support and resistance.
The ratios of Fibonacci channels are the same as those found in Fibonacci retracements, but the lines are drawn diagonally rather than horizontally as in the traditional retracement model. For reference, these ratios are most often taken to be 0%, 23.66%, 38.2%, 50%, 61.8%, 76.4% and 100%.
Learn more about Fibonacci retracements
Traders will place buy or sell orders on the underlying depending on how the price interacts with these ratio levels. However, the main issue with Fibonacci channels as opposed to the other channel indicators on this list is that they must be drawn manually by a trader onto a price chart, meaning that their placement is subjective and different traders could get different information from the same chart.
Because of this, it is advised to use Fibonacci channels alongside other trading channel indicators to confirm a trend before placing a buy or sell order on the underlying market.
Stoller average range channel (STARC) bands
STARC bands are another enveloping channel which can show potential areas of support and resistance. The indicator is made up of a positive and a negative band, and a trader may wish to enter a buy or sell position depending on which band the asset is currently trading towards.
For example, in an ascending trend of higher highs and higher lows, many traders will seek to buy near the negative band and sell near the positive band. In this respect, the strategy for trading with STARC bands is similar to the other channel trading indicators on this list, in that a trader should buy near support and sell near resistance.
However, if the asset’s price movements break through either the upper or lower band, it could demonstrate a possible trend reversal and traders may wish to close their current position and open a new one in the opposite direction.
STARC bands are similar to Keltner channels because they comprise an upper and lower band which are derived from an average true range value. However, compared to the EMA of Keltner channels, STARC bands use a SMA as the centre line.
The formula to calculate STARC bands is as follows:
- Upper STARC = SMA + (multiplier x ATR)
- Lower STARC = SMA – (multiplier x ATR)
The SMA for STARC bands is usually between a five and ten-day period, and the multiplier is usually two – but this can be adjusted based on a trader’s personal preference.
Trading channels summed up
- Trading channels show traders potential areas of support and resistance – with many believing that within a channel, the price will either retrace or break out once it has reached either of these two levels
- There are different types of trading channel, with the most popular being ascending, descending, horizontal and enveloping
- Each of these channels show different trends. A trader will tend to buy or sell according to the prevailing trend, while taking the opposite position if the asset’s price reaches support or resistance
- Aside from the four types of trading channel, there are also many popular trading channel indicators which are used to show areas of support and resistance, as well as denoting current asset volatility based on price action
- It is best to use these indicators alongside each other, in order to confirm a prevailing trend, a potential retracement or a reversal before opening a position
This information has been prepared by IG, a trading name of IG Markets Limited. In addition to the disclaimer below, the material on this page does not contain a record of our trading prices, or an offer of, or solicitation for, a transaction in any financial instrument. IG accepts no responsibility for any use that may be made of these comments and for any consequences that result. No representation or warranty is given as to the accuracy or completeness of this information. Consequently any person acting on it does so entirely at their own risk. Any research provided does not have regard to the specific investment objectives, financial situation and needs of any specific person who may receive it. It has not been prepared in accordance with legal requirements designed to promote the independence of investment research and as such is considered to be a marketing communication. Although we are not specifically constrained from dealing ahead of our recommendations we do not seek to take advantage of them before they are provided to our clients.

Explore the markets with our free course
Discover the range of markets and learn how they work - with IG Academy's online course.
