Where to next for FAANG shares?
Technical outlook on FAANG share prices post Fed’s 75-basis point rate hike.
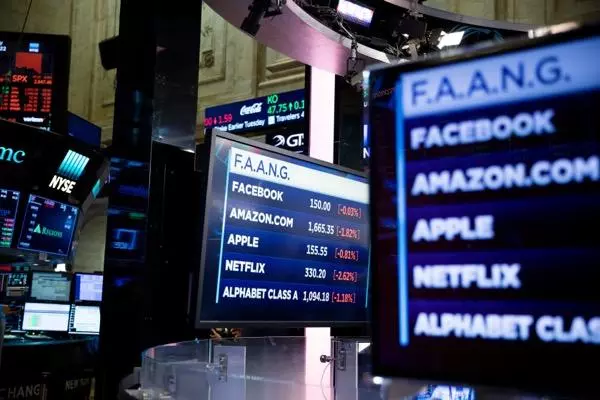

That old adage ‘the trend is your friend’ clearly holds true for FAANG (Facebook, Amazon, Apple, Netflix, Google) stocks with these continuing to rapidly slide from last year’s highs.
Meta (formerly known as Facebook) is down around 50% year-to-date and sliding, with it about to reach its June 2019 low at $160.90, below which the 2020 Covid-19 pandemic low can be spotted at $137.13.
Only a currently unexpected bullish reversal and rise above Meta’s early June high at $202.01 would invalidate the current short-term downtrend and could lead to a retest of the early April high at $236.81 being seen.

Amazon’s share price, although also in a clear bear market, has fared relatively better than Meta’s, though, with it so far trading around 40% lower than at the beginning of the year, within its key $102.51 to $101.35 support zone. It contains the September, October 2018, July 2019 highs, and May 2022 low. Below it lies the minor psychological $100 mark and April 2019 and March 2020 highs at $99.87 to $98.41.
Since a confluence of previous highs often works as a zone of support in the future, the Amazon share price may well find support in the $102.51 to $98.21 region. Were it to give way, though, and a weekly chart close below the $98.21 level to ensue, we would have to allow for the next lower band of support between the June and October 2019 and March 2020 lows at $83.61 to $80.91 to be reached.

The third FAANG stock, Apple, has slid through the 38.2% Fibonacci retracement of its 2020-to-2022 uptrend at $133 but is so far having a less dramatic year-to-date drop of around 25% compared to its peers but nonetheless remains in a technical bear market.
The Apple share price seems to be gunning for the $127.56 to $125.21 support zone which consists of the October 2020 and March 2021 highs and the January 2021 low.
Another potential downside target area is made up of the 50% retracement of the 2020-to-2022 bull market and the March 2021 low at $117.60 to $115.28.

Moving onto a weekly Netflix chart, the worst performing FAANG share, with an over 70% drop in its share price year-to-date, and one can see that a drop through its May low at $162.75 looks imminent, in which case the share would be trading back at levels last seen in July 2017 whilst approaching the minor psychological $150 mark.

And finally, the best, or shall one say, least worst performing of all the FAANG stocks is currently Alphabet (formerly known as Google) which is down close to 25% since the beginning of the year and still some way off its $2,039 May low. It was made close to the 50% retracement of the pandemic bull market and the February 2021 lows which went as far as $1,991.
While the $2,039 to $1,991 area holds, a bullish medium-term bullish reversal may take shape but for it to gain traction a weekly rise and chart close above the early June high at $2,386 will need to be seen.
Failure at $1,991 would open the way for the November 2020 high, 61.8% Fibonacci retracement and 200-day simple moving average (SMA) at $1,844 to $1,761 to be reached.

This information has been prepared by IG, a trading name of IG Markets Limited. In addition to the disclaimer below, the material on this page does not contain a record of our trading prices, or an offer of, or solicitation for, a transaction in any financial instrument. IG accepts no responsibility for any use that may be made of these comments and for any consequences that result. No representation or warranty is given as to the accuracy or completeness of this information. Consequently any person acting on it does so entirely at their own risk. Any research provided does not have regard to the specific investment objectives, financial situation and needs of any specific person who may receive it. It has not been prepared in accordance with legal requirements designed to promote the independence of investment research and as such is considered to be a marketing communication. Although we are not specifically constrained from dealing ahead of our recommendations we do not seek to take advantage of them before they are provided to our clients.

Seize a share opportunity today
Go long or short on thousands of international stocks.
- Increase your market exposure with leverage
- Get spreads from just 0.1% on major global shares
- Trade CFDs straight into order books with direct market access
Live prices on most popular markets
- Forex
- Shares
- Indices
