Tesla’s share price: what to expect from Q3 results
Find out what to expect from Tesla’s earnings results, how they will affect Tesla share price, and how to trade Tesla’s earnings.


When is Tesla’s results date?
Third quarter (Q3) figures for the closely watched electric vehicle company will be released on Wednesday, 20 October 2021 after market close, and from its new headquarters in Texas.
Tesla share price: forecasts from Q3 results
When it comes to deliveries figures released earlier this month, a total of 241,300 electric cars during the Q3 of this year took analysts by surprise, surpassing expectations of around 220K vehicles, its production during the period around 238K cars, and where a vast majority of them – over 96% – were the more affordable Model 3 and Y, the remaining minority the higher end Model S and X. Last time around 99% of the 201K vehicles delivered in the second quarter (Q2) were made up of the more reasonably priced low-margin duo, though that didn’t stop Tesla from reporting net income that for the first time surpassed $1 billion, regulatory credits making up less than a third of that amount, and gross margins higher than the four quarters (Q4) that preceded it.
Given deliveries are larger this time around (with a record 56K of Chinese-made vehicles according to China Passenger Car Association (CPCA)), and analysts have been scrambling to revise earnings upwards, 26% higher than what average estimates were a few months back. Price increases and supply chain woes are items investors and traders are noting, and aren’t exclusive to Tesla’s earnings which given the increase in production has meant it has managed the semiconductor shortage better than its competitors. Regulatory credits ought to mean even less moving forward with both non-electric vehicle competition entering into the sphere, and electric vehicle startups boosting production. Exposure to cryptocurrencies is considered a plus this time around with bitcoin prices over a third higher than at the start of the Q3.
Overall, expectations this time around are for an earnings per share of $1.5, nearly double its reading for the same quarter last year, and slightly above its Q2 reading. Revenue is also expected to rise to over $13 billion from revenue of almost $12 billion in the last quarter. There’s also the question of whether full-year guidance will be revised higher, and by how much. Recommendations amongst analysts continue to vary but are less at the extremes than they were in August and September, the median in the middle and overall averaging to a slight buy rating, though unlike last time its share price is above the average price target (source: finance.yahoo.com).
Trading Tesla’s Q3 results: weekly technical overview and trading strategies
From a technical standpoint – and it’ll always mean less in the face of a fundamental event where levels will hold less relevance as market makers withdraw their liquidity to avoid getting stuck on a volatile trend move opposite – it’s been far more positive since the last time it released its figures and where key technical indicators were mostly neutral.
Prices are above all its main short and long-term moving averages in both daily and weekly time frames, a positive Directional Movement Index (DMI) on the short-term daily with the Plus Directional Indicator (DI+) also above the Minus Directional Indicator (DI-) on the weekly time frame though by a smaller margin. It’s at the upper end of the Bollinger bands in both time frames with relative strength index (RSI) readings just below overbought territory on the weekly, and where the average directional movement index (ADX) isn’t showing a propensity to trend in the longer-term weekly time frame as it is on the daily.
Overall, while the technical overview is bullish in both time frames with prices within its bull trend channel, follow-through beyond key levels has been limiting and lacking momentum, and it stands near a significant resistance level, meaning a bull trend overview that’s stalling in the sense that buy-breakout strategies even if net outperforming on the run up to these levels have been tested by consolidatory moves back towards the lower end of the channel.
Conformist strategies for those expecting the bull run to offer more upside potential are therefore buys off of key levels, though ideally via reversal if initiating on a drop towards key support levels, while daring contrarians can consider sell strategies as clarified below, though keeping in mind it’s opposite the current technical overview, and where risking a lot for what thus far has been small rewards could backfire should the trend persist.
| Current technical overview | Bull trend - stalling |
| Technical overview conformist strategies | Buy 1st support after reversal, buy 1st resistance upon breakout from below |
| Technical overview contrarian strategies | Sell 1st resistance at/before price, sell 1st support upon breakout from above |
| S/L for 2nd resistance | 922.07 |
| 2nd resistance | 900.40 |
| S/L for 1st resistance | 878.74 |
| 1st resistance | 857.07 |
| Relative starting point | 813.73 |
| 1st support | 770.39 |
| S/L for 1st support | 748.72 |
| 2nd support | 727.06 |
| S/L for 2nd support | 705.39 |
Source: IG
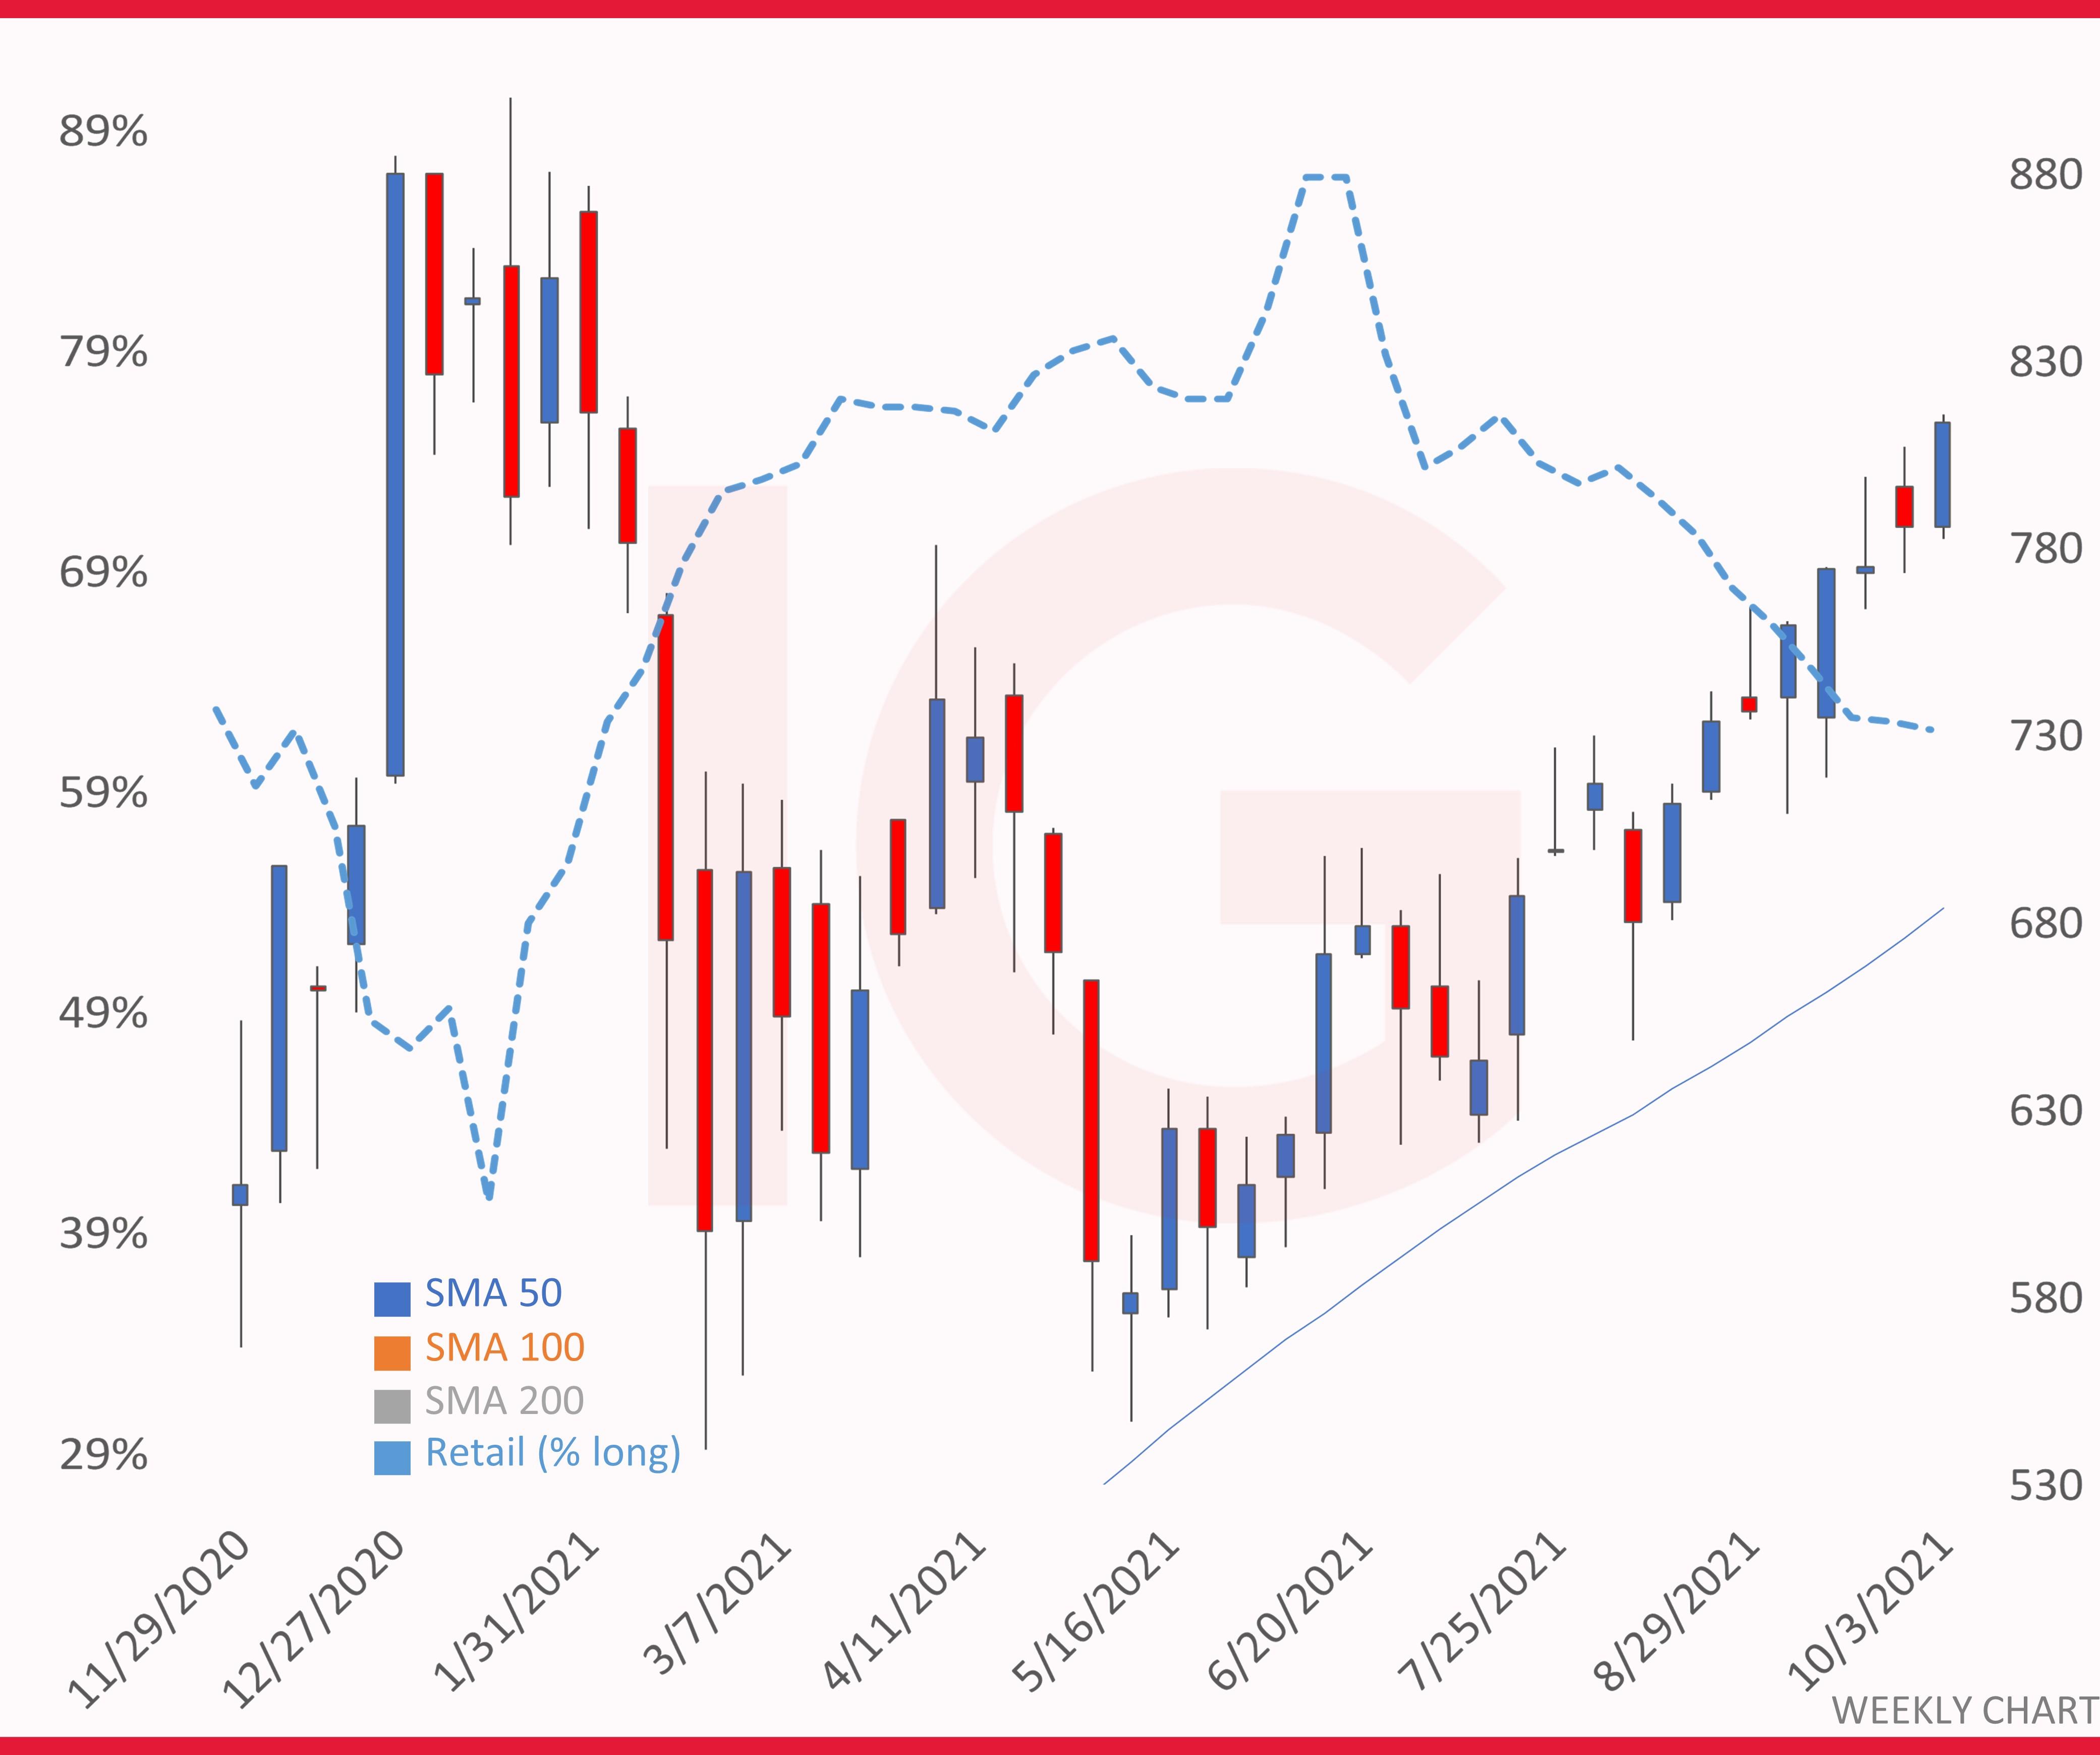
Tesla Weekly Chart with retail sentiment (blue-dotted line)
IG Client sentiment* and short interest for Tesla shares
Retail trader bias was a consistent heavy buy bias prior to the recent bull trend moves, but with consistent price gains and some longs have been enticed into closing out, while some shorts getting tempted into initiating near a long-term resistance level last seen in April, the blue-dotted line in the chart above representing retail trader bias as % long steadily dropping.
As a result, while it’s still majority long sentiment held amongst IG’s clients (and in turn net beneficiaries of the latest bull run), it has dropped out of heavy buy territory to settle at 61% according to the latest reading, down from 63% at the start of last week.
As for short interest, it has dropped further from where it was prior to Q2 earnings at 34,093,281 where it was 4.4% of shares floated, to 29.2 million representing a smaller 3.64%, and far less than the heavier 60 million readings we saw last year (source: shortsqueeze.com).
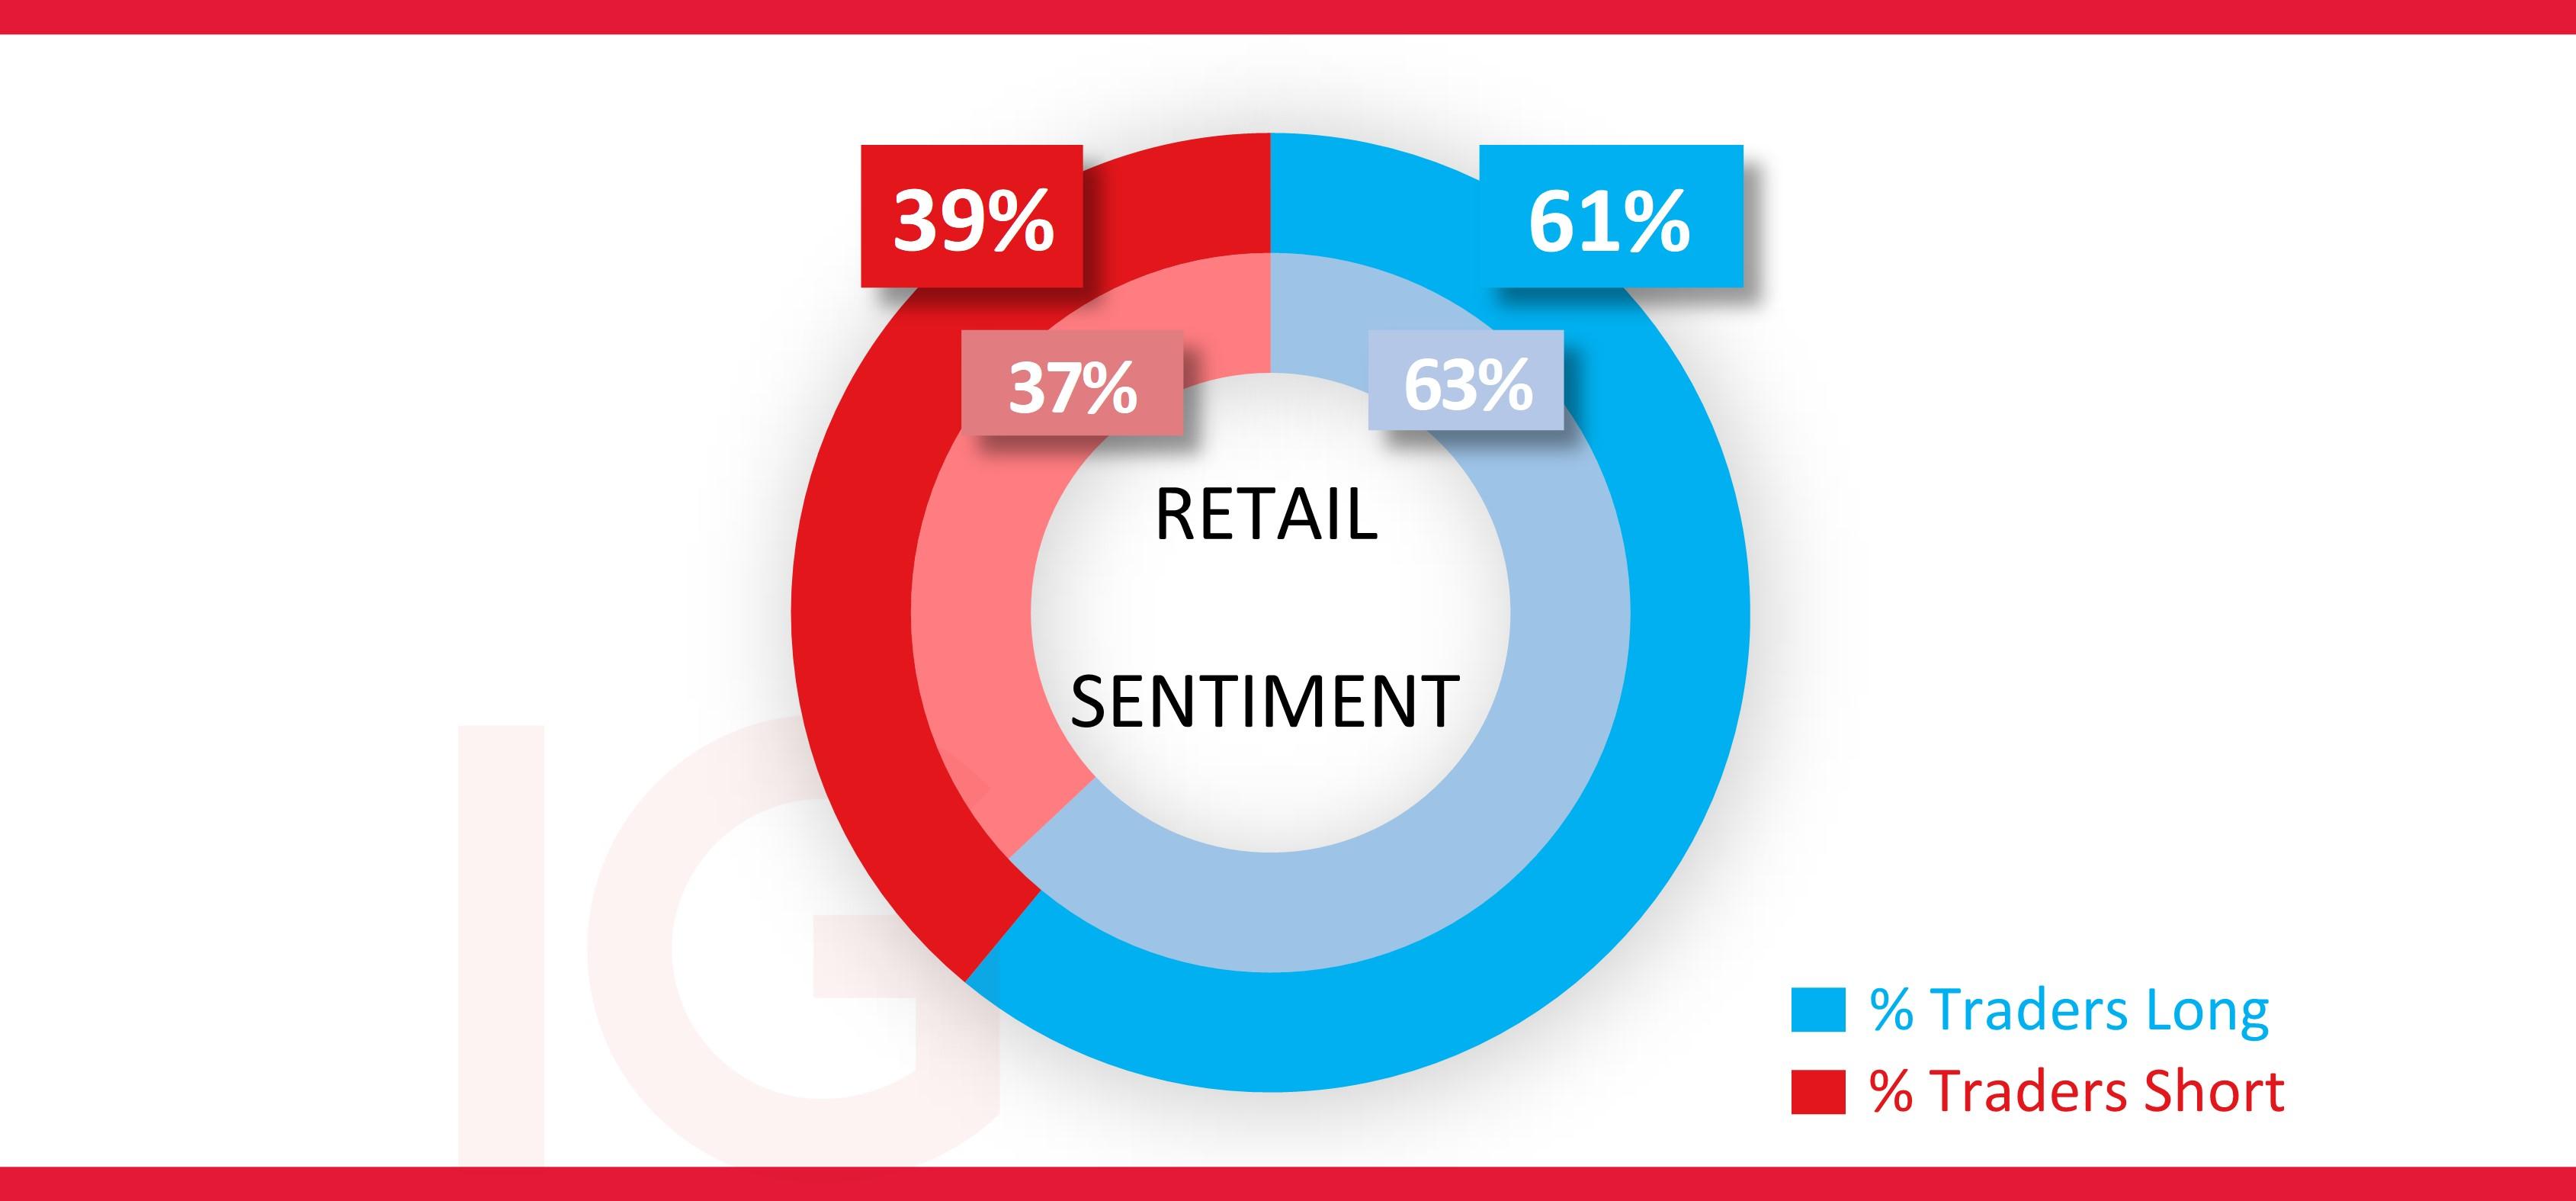
*The percentage of IG client accounts with positions in this market that are currently long or short. Calculated to the nearest 1%, as of today morning 8am for the outer circle. Inner circle is from the previous trading day.
This information has been prepared by IG, a trading name of IG Markets Limited. In addition to the disclaimer below, the material on this page does not contain a record of our trading prices, or an offer of, or solicitation for, a transaction in any financial instrument. IG accepts no responsibility for any use that may be made of these comments and for any consequences that result. No representation or warranty is given as to the accuracy or completeness of this information. Consequently any person acting on it does so entirely at their own risk. Any research provided does not have regard to the specific investment objectives, financial situation and needs of any specific person who may receive it. It has not been prepared in accordance with legal requirements designed to promote the independence of investment research and as such is considered to be a marketing communication. Although we are not specifically constrained from dealing ahead of our recommendations we do not seek to take advantage of them before they are provided to our clients.

Seize a share opportunity today
Go long or short on thousands of international stocks.
- Increase your market exposure with leverage
- Get spreads from just 0.1% on major global shares
- Trade CFDs straight into order books with direct market access
Live prices on most popular markets
- Forex
- Shares
- Indices
