Market morning update: Nasdaq 100, Gold, Hang Seng Index, Brent crude
Thus far, expectations have been well-anchored for a resolution in the US debt ceiling situation, so any upcoming obstacle to a smooth pass-through of the deal could still trigger some de-risking.

Market Recap
The call for support among policymakers in the US debt ceiling deal continues ahead of a House vote on Wednesday, which translated to a mixed tone in Wall Street to kickstart the new trading week. Thus far, expectations have been well-anchored for a resolution in the US debt ceiling situation, so any upcoming obstacle to a smooth pass-through of the deal could still trigger some de-risking, such as any failure to attain the required vote from the House chamber ahead and the need for more back-and-forth negotiations.
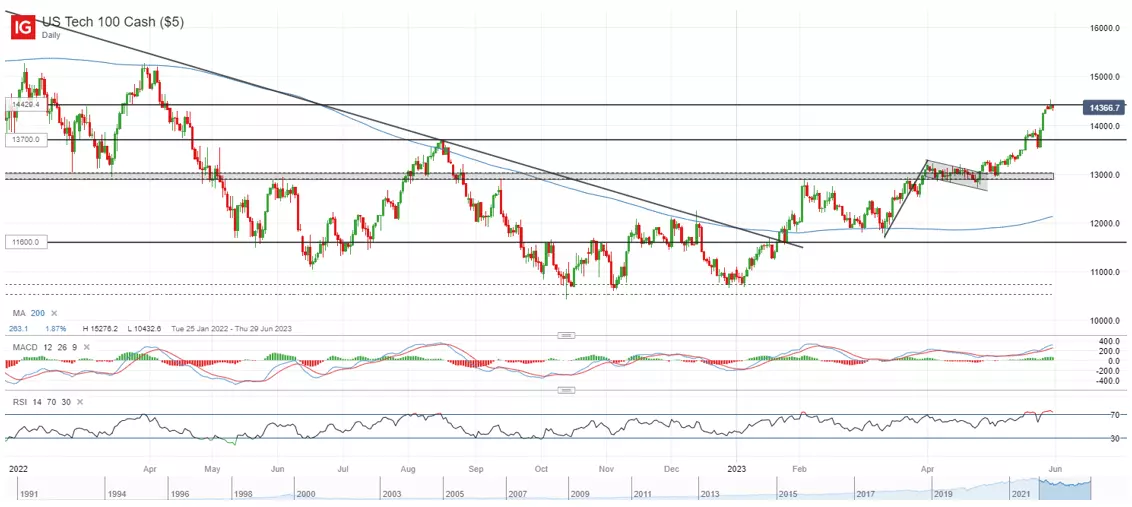
Only 3 out of 11 S&P 500 sectors are in the green overnight, with Nvidia’s adding another 3% to its recent gains and continuing to uplift the Nasdaq. That said, some signs of exhaustion seem to be displayed, with the Nasdaq 100 index displaying a long-tailed candlestick overnight as a reflection of selling pressure in place. This follows just as the index nears the projected target level from its previous bullish flag formation. Any subsequent move below Tuesday’s close may raise the odds of a near-term retracement. Further downside may also prompt the Relative Strength Index (RSI) to revert into neutral territory (<80), which may draw more technical sellers.
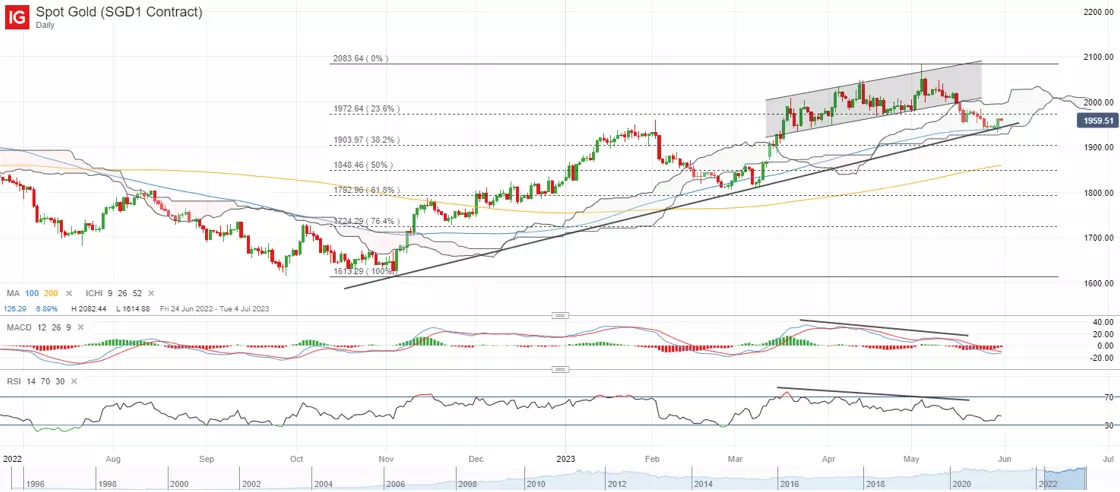
Treasury yields were sharply lower overnight, seemingly more of a caution to debt ceiling developments rather than a hawkish build in rate expectations. That dragged the US Dollar 0.3% lower, but still largely trades within a near-term consolidation from last Thursday. Declining Treasury yields and a weaker US dollar have allowed gold prices to defend its support confluence zone at the US$1,940 level for now (upward trendline, Ichimoku cloud, 100-day moving average). That said, the downward trend since early-May could still leave any formation of a lower high on watch, with greater conviction for a more sustained upside potentially having to come from a move back above the key psychological US$2,000 level.
Asia Open
Asian stocks look set for a mixed open, with Nikkei -0.81%, ASX -0.85% and KOSPI +0.24% at the time of writing, largely tracking the downbeat tone in Wall Street overnight. The release of China's official manufacturing purchasing managers' index (PMI) posed another downside surprise (48.8 versus 49.4 forecast), pointing to a deeper contraction from April as compared to broad expectations for a slight recovery. Non-manufacturing PMI disappointed as well, reflecting a continued tapering off from the strong reopening boost at the start of the year (54.5 versus 55.2 forecast). A lower-for-longer growth picture seems to be reflected here, adding to the series of economic downside surprises witnessed over the past month, potentially with the need for more policy support from authorities to provide some reassurances for market participants.
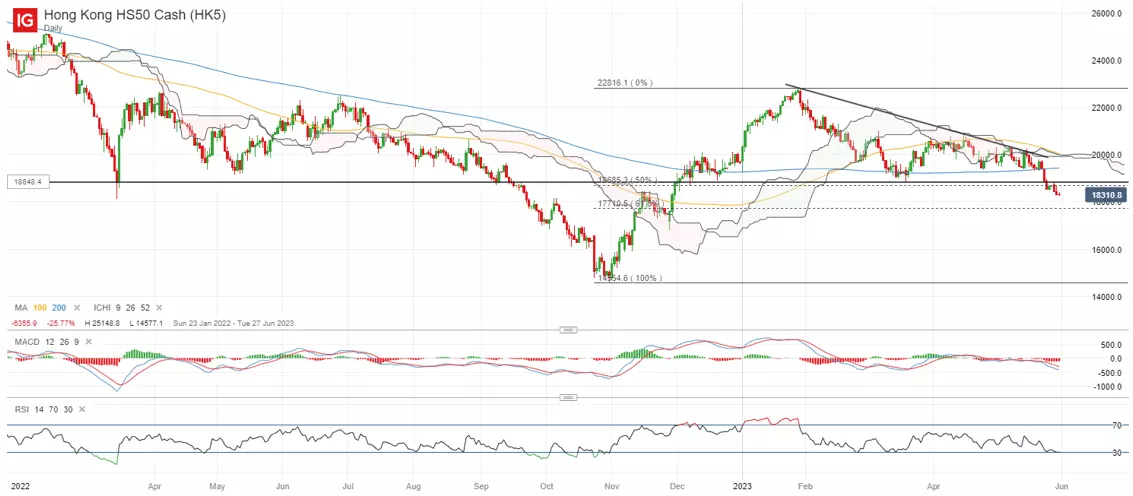
The Hang Seng Index continued to pull away from its 200-day moving average (MA), down 1.5% at the time of writing which may give rise to bear-market chatters over coming days. A bearish rejection off a previous support-turned-resistance provides testament to sellers in control, which could pave the way towards the 17,700 level next. The lower highs and lower lows kept the bearish bias for now, with several resistance (200-day MA, downward trendline, Ichimoku cloud) needed to be overcome to provide conviction of a renewed upward trend.
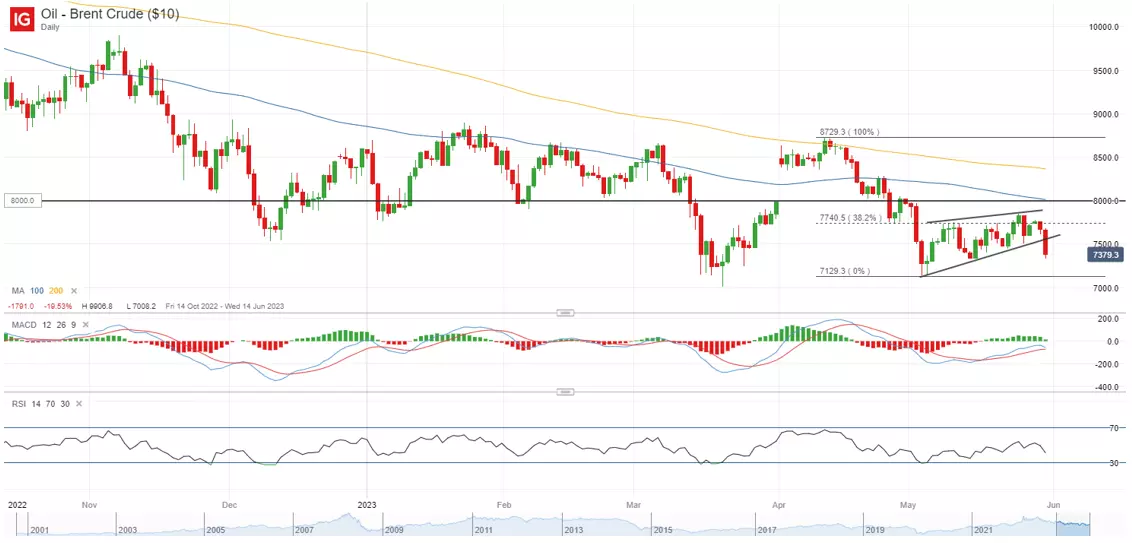
On the watchlist: Breakdown of rising wedge pattern for Brent crude
Oil prices have given back its past weeks’ gains, with a more subdued risk environment and mixed views out of Organisation of the Petroleum Exporting Countries (OPEC+) members on production cuts translating to a 3.7% move lower for Brent Crude overnight. While any announcement of production cuts in the upcoming 4 June OPEC+ meeting may be looked upon as a positive surprise and support a temporary boost for oil prices, one may recall how prices were quick to pare back on its April gains (previous oil output cuts), as downside risks to global growth remain a key overhang.
Having traded in a wider consolidation pattern since December last year, greater conviction for a renewed upward trend may have to come from a move back above the upper consolidation range at the US$88.60 level. For now, a breakdown of a rising wedge pattern in a downward trend seems to provide a bearish bias, which could leave the May bottom at the US$71.30 level on watch for a retest.
Tuesday: DJIA -0.15%; S&P 500 -0.00%; Nasdaq +0.32%, DAX -0.27%, FTSE -1.38%
This information has been prepared by IG, a trading name of IG Markets Limited. In addition to the disclaimer below, the material on this page does not contain a record of our trading prices, or an offer of, or solicitation for, a transaction in any financial instrument. IG accepts no responsibility for any use that may be made of these comments and for any consequences that result. No representation or warranty is given as to the accuracy or completeness of this information. Consequently any person acting on it does so entirely at their own risk. Any research provided does not have regard to the specific investment objectives, financial situation and needs of any specific person who may receive it. It has not been prepared in accordance with legal requirements designed to promote the independence of investment research and as such is considered to be a marketing communication. Although we are not specifically constrained from dealing ahead of our recommendations we do not seek to take advantage of them before they are provided to our clients.

Seize a share opportunity today
Go long or short on thousands of international stocks.
- Increase your market exposure with leverage
- Get spreads from just 0.1% on major global shares
- Trade CFDs straight into order books with direct market access
Live prices on most popular markets
- Forex
- Shares
- Indices
