EUR/USD stabilizes while EUR/GBP rallies and GBP/USD tumbles
EUR/USD stabilizes while EUR/GBP rallies and GBP/USD tumbles on dovish BoE comments regarding rapidly falling inflation.


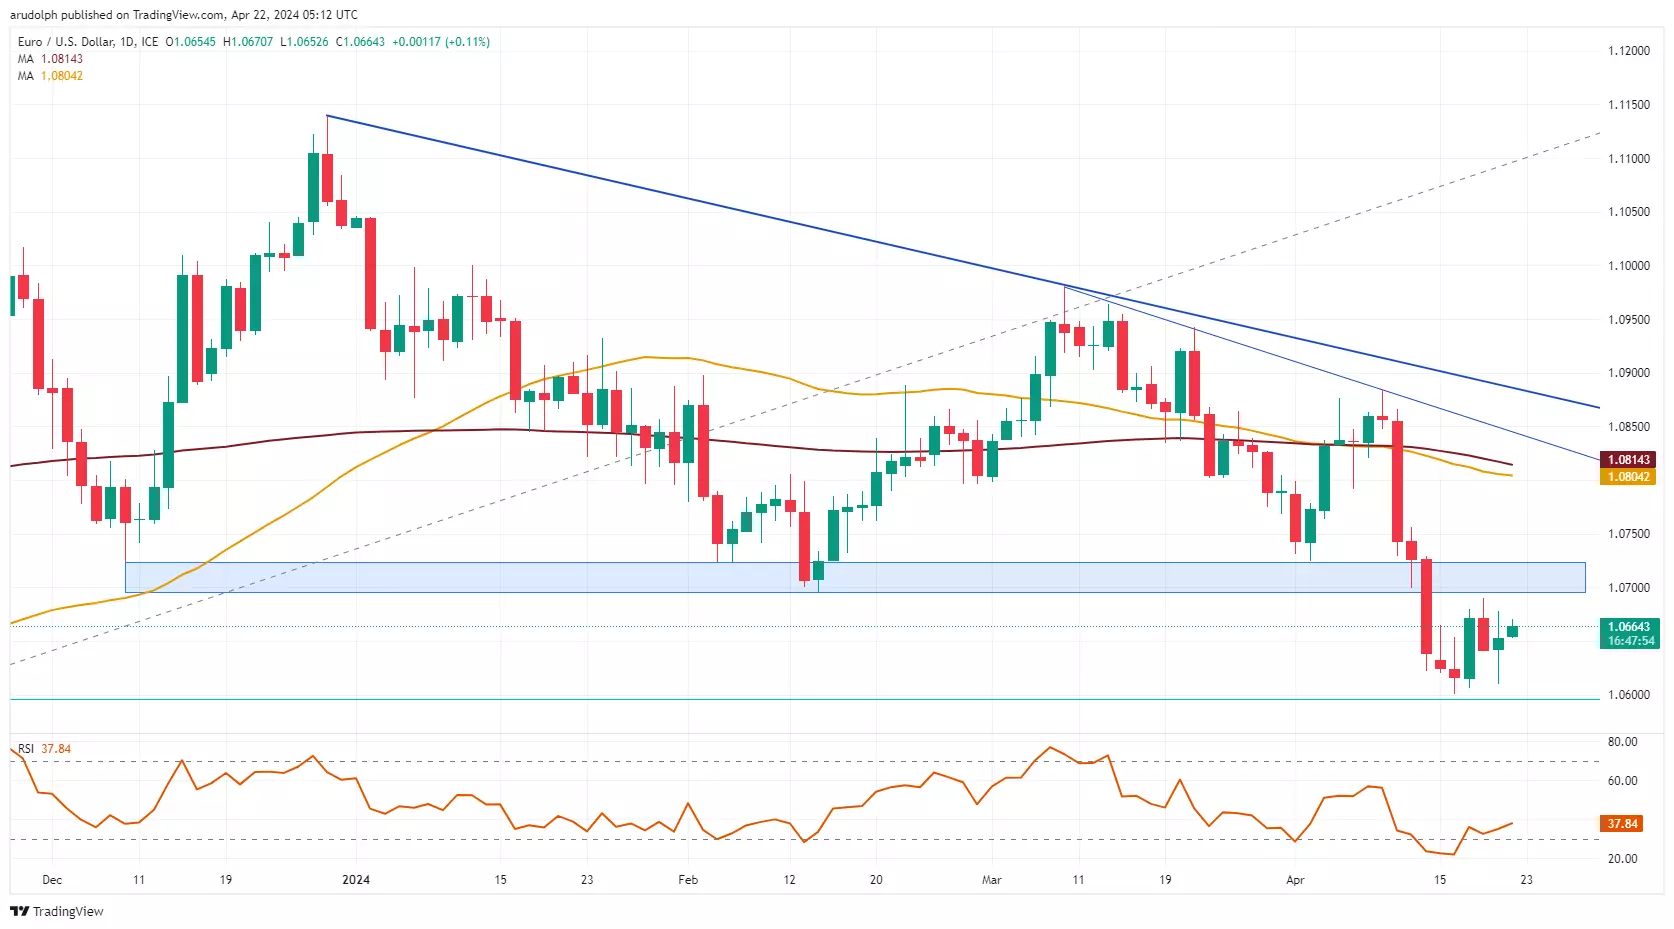
EUR/USD stabilizes
EUR/USD is now range trading between its key $1.069 to $1.0725 resistance zone and last week's $1.0601 low. Below it lies the 78.6% Fibonacci retracement of the October-to-December advance at $1.0596 and further down the late October lows at $1.0522 to $1.0517 as well as the $1.0449 October low. All of these remain medium-term in sight.
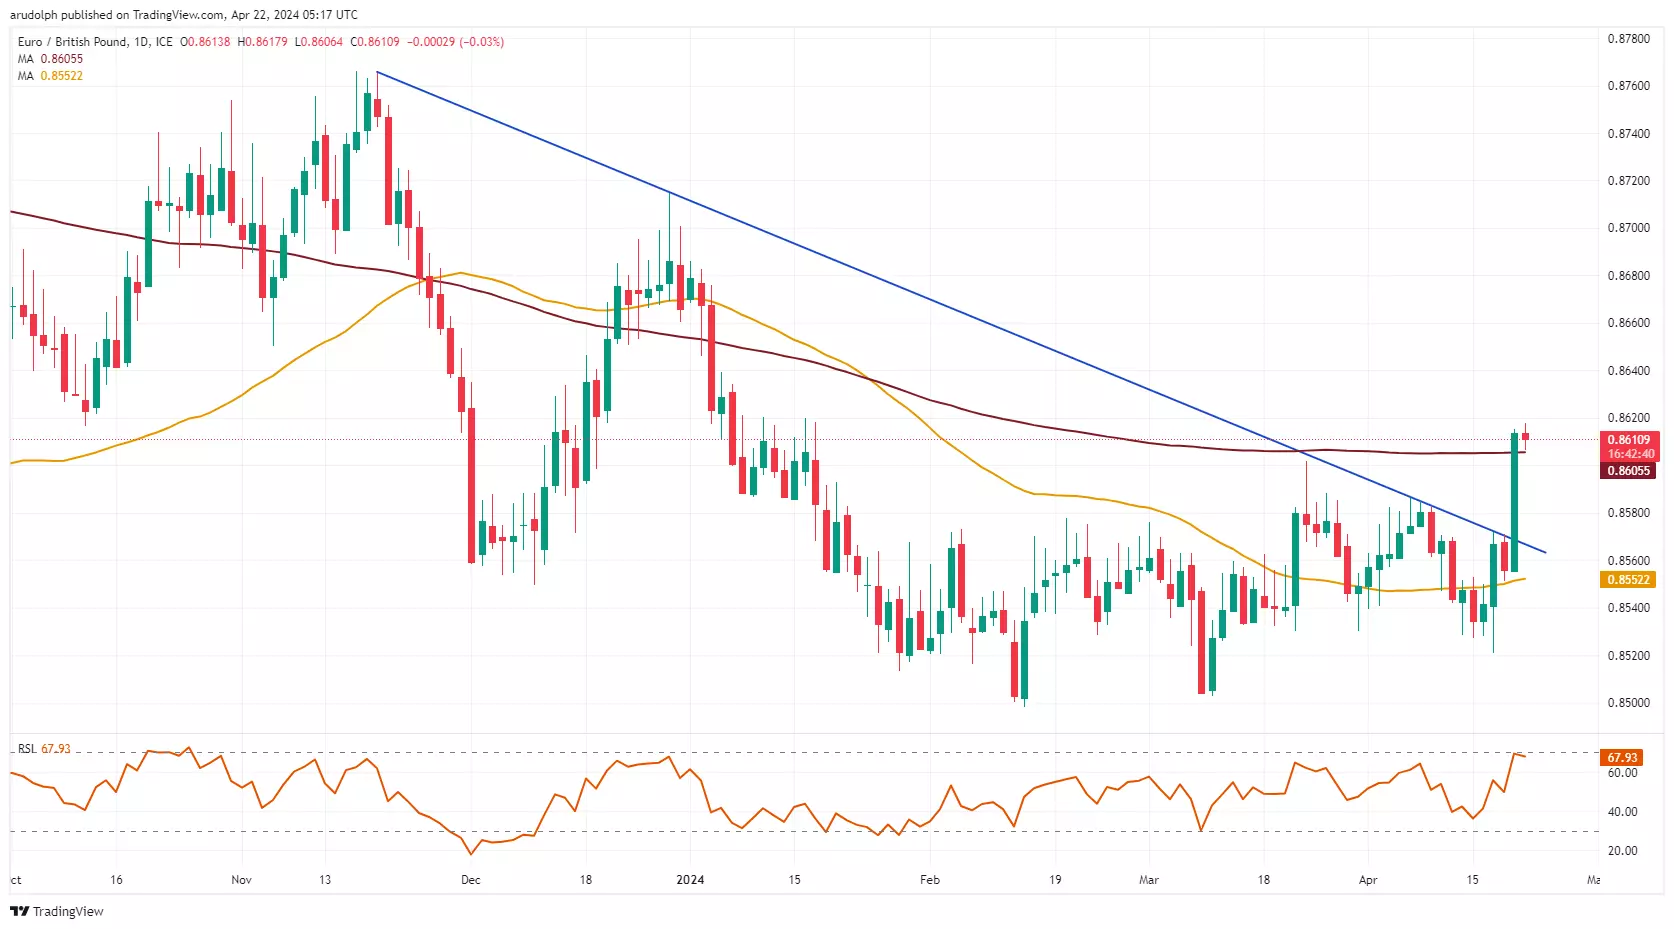
EUR/GBP sees sharp rally
EUR/GBP has swiftly risen above the 200-day simple moving average (SMA) at £0.8605 and reached the October low at £0.8617 which acts as resistance. If bettered, the £0.8630-31 mid-September high and late September low will be in focus. Slips to below the 200-day SMA should find support around the March high at £0.8602. Below it lie the 5 to 9 April highs at £0.8586-82.
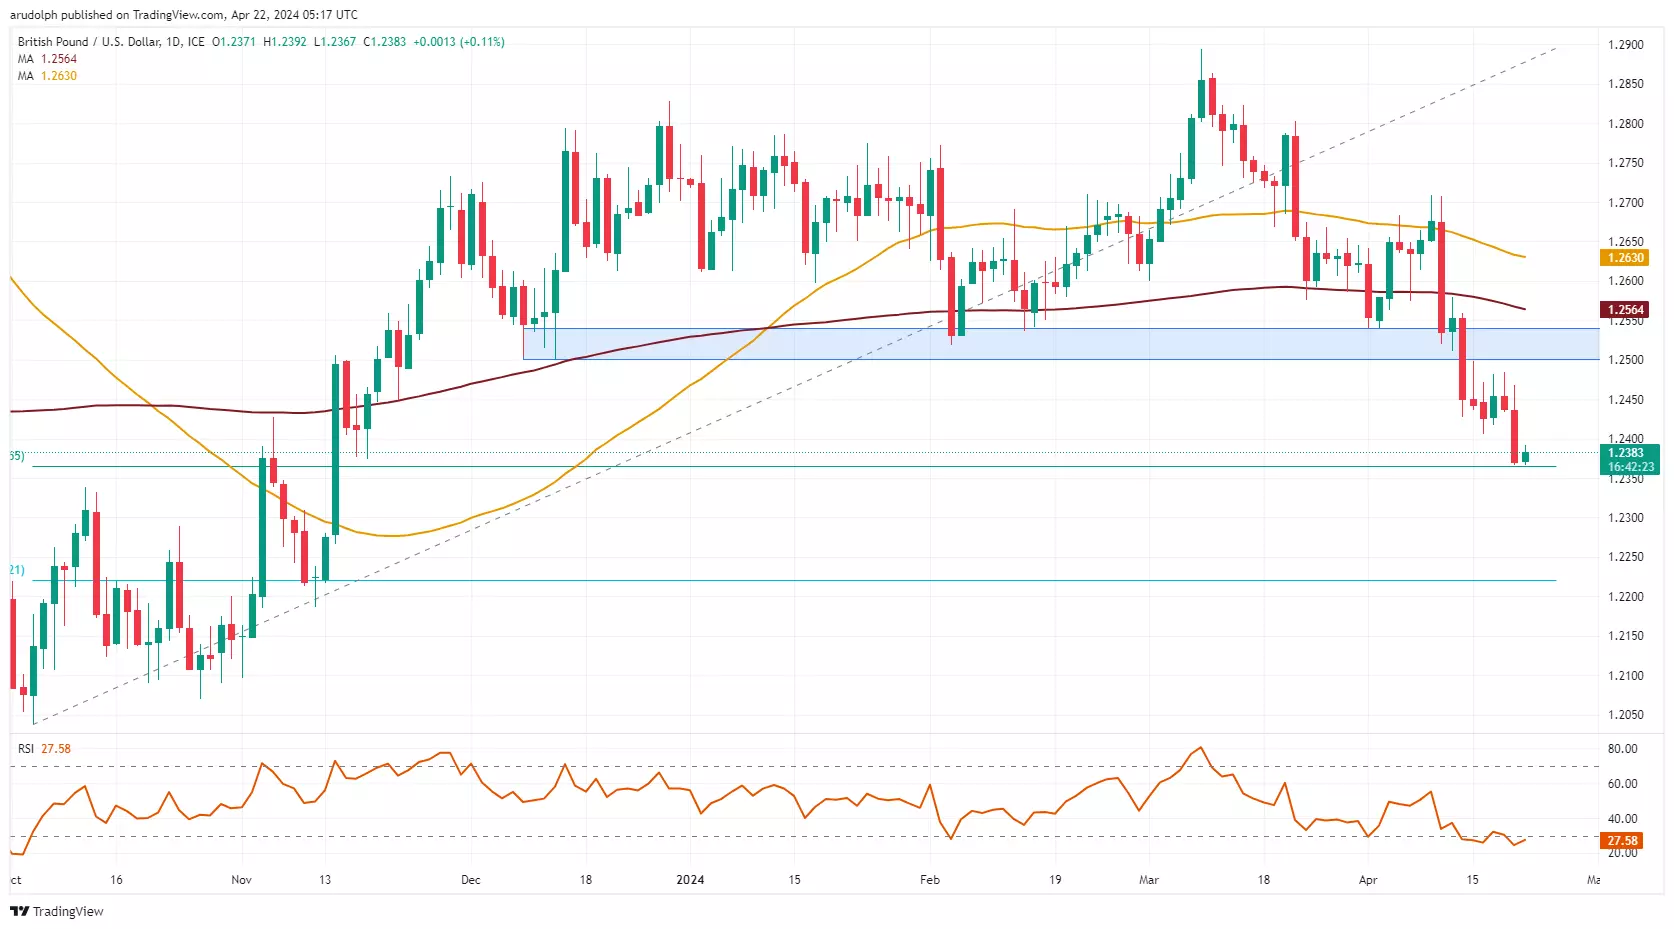
GBP/USD tumbles further
GBP/USD resumed its descent and nears the 61.8% Fibonacci retracement of the October-to-March rise at $1.2365. Further down sits the mid-October high at $1.2338. Minor resistance can be spotted at last Tuesday's $1.2406 low.
This information has been prepared by IG, a trading name of IG Markets Limited. In addition to the disclaimer below, the material on this page does not contain a record of our trading prices, or an offer of, or solicitation for, a transaction in any financial instrument. IG accepts no responsibility for any use that may be made of these comments and for any consequences that result. No representation or warranty is given as to the accuracy or completeness of this information. Consequently any person acting on it does so entirely at their own risk. Any research provided does not have regard to the specific investment objectives, financial situation and needs of any specific person who may receive it. It has not been prepared in accordance with legal requirements designed to promote the independence of investment research and as such is considered to be a marketing communication. Although we are not specifically constrained from dealing ahead of our recommendations we do not seek to take advantage of them before they are provided to our clients.

Start trading forex today
Trade the largest and most volatile financial market in the world.
- Spreads start at just 0.6 points on EUR/USD
- Analyse market movements with our essential selection of charts
- Speculate from a range of platforms, including on mobile
Live prices on most popular markets
- Forex
- Shares
- Indices
