What is the CAPE ratio and how do you calculate it?
The CAPE ratio is a popular way of assessing how long-term business cycles impact a company’s valuation. Discover the difference between the CAPE ratio and P/E ratio, and how to calculate the CAPE ratio for stocks and indices.


What is the CAPE ratio?
The CAPE ratio is a comparison of a stock or index price to its total earnings, which is used to tell whether its’s over or undervalued. It’s an extension of the traditional price-to-earnings ratio (P/E) that monitors a ten-year period to account for variations in profitability due to economic cycles.
The CAPE ratio – which stands for cyclically-adjusted price-to-earnings – is also known as the Shiller P/E. It was named after professor Robert Shiller who first developed the method, alongside his colleague John Young Campbell. The two suggested ten-year earnings were strongly correlated with returns for the next 20 years.
The ratio is used to measure a company’s profitability under different economic influences. Profit peaks and troughs are extremely common as consumer spending habits change significantly in periods of economic boom or bust. Taking these swings into account can help show whether a company will perform in the long run and is worth investing in.
Learn more about investing with us
CAPE ratio vs P/E ratio: what are the differences?
The P/E ratio is the price of a stock, divided by its earnings in a single year. While the market price of a stock tells us how much investors are willing to pay to own the stock, the P/E ratio reveals whether or not the share price is an accurate representation of the company’s earnings potential.
If the P/E ratio figure is high when compared to other companies in the industry or an index – typically above 11 – then the stock is overvalued. And if the P/E ratio is low – below ten – then it is undervalued.
However, critics of the P/E ratio argued that using just one year of profits couldn’t give an accurate representation of profits. So, the CAPE ratio was created, which uses a ten-year average of inflation-adjusted earnings. This means it can take into account longer-term business cycles and smooth out short-term market movements and volatility.
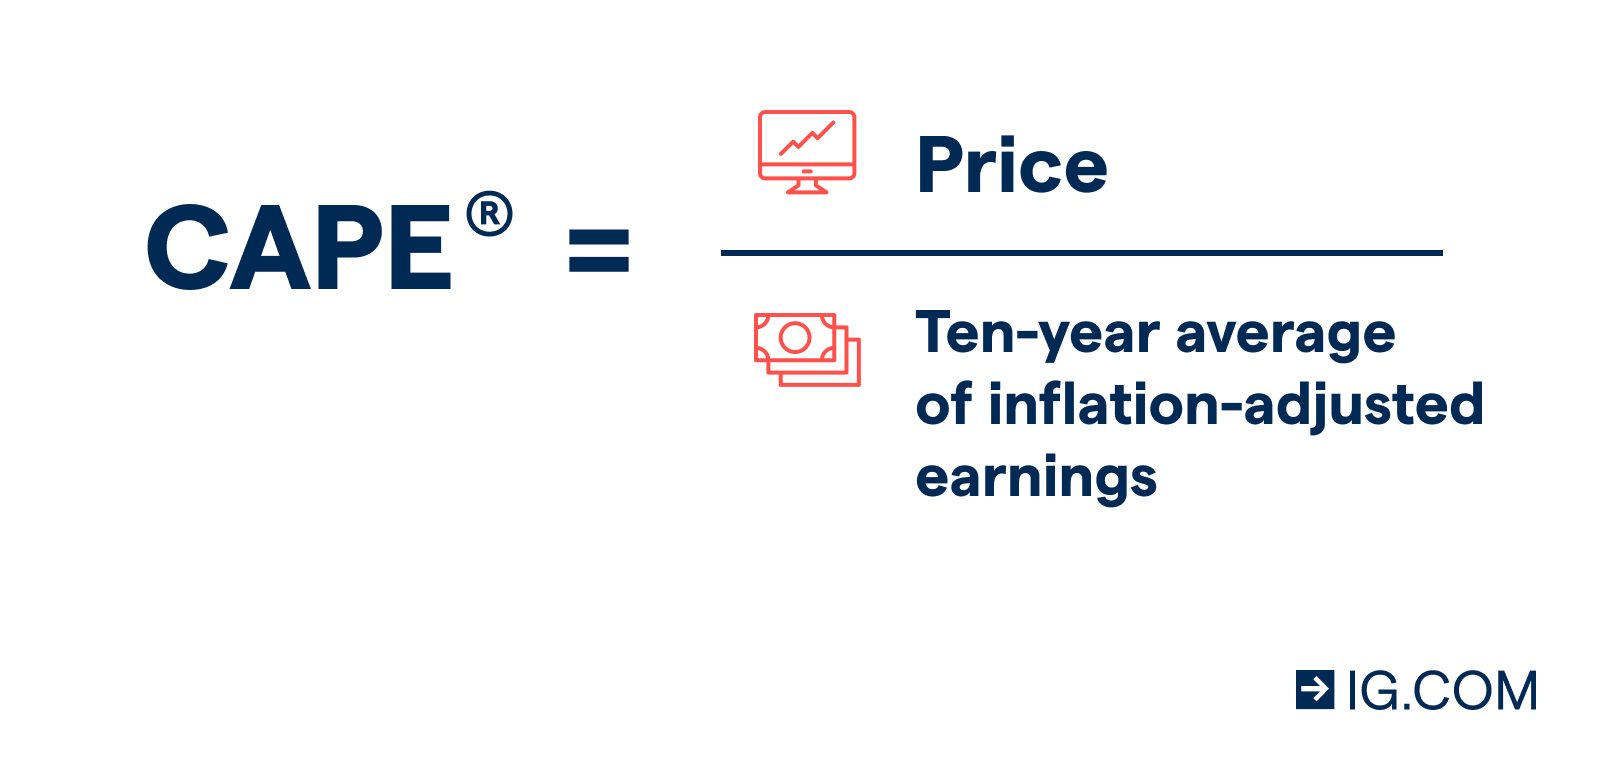
How to calculate the CAPE ratio
The CAPE ratio is calculated by dividing a company’s stock price by the average of the company’s earnings over a ten-year period and adjusting it for inflation.
How to calculate the CAPE ratio
The CAPE ratio is calculated by dividing a company’s stock price by the average of the company’s earnings over a ten-year period and adjusting it for inflation.
In the same way as the P/E ratio, a stock with a high CAPE ratio is considered overvalued, and a stock with a low CAPE ratio would said to be undervalued.
The CAPE ratio and forecasting
The CAPE ratio is used to forecast the likely earnings of a company or index over the next 20 years. The theory is that the lower the value of the ratio, the higher the return from equities over the next two decades as the stocks come into line with their true value. And the higher the value of the ratio, the less likely equities are to achieve oversized returns, as their stock prices are inflated already.
Critics of the CAPE ratio point out that it’s not very useful for forecasting market valuations, as it is inherently a lagging indicator – meaning it looks a historical patterns rather than current or forward-looking trends.
Learn more about leading and lagging indicators
It’s also worth noting that, accounting practices have changed since the CAPE ratio was created – making historical comparisons difficult as earnings are no longer calculated in the same way. This means the metric isn’t always going to be 100% accurate.
How to use the CAPE ratio in your trading
To use the CAPE ratio in your trading, you’d divide your chosen company’s latest share price by its average earnings over the previous ten years. If it is a low CAPE ratio, you could consider buying the stock in the expectation that it will rise in value over the longer term. And if it is a high CAPE ratio, you would need to consider the company’s fundamentals before you opened a position, as there is the possibility the stock price could fall if market participants are unwilling to support its inflated price.
Learn about stock market rallies
The CAPE ratio is better suited to long-term valuations of the stock market than the P/E ratio, which makes it more useful for investors who are looking at a timeframe of years – rather than traders who might only hold a position on a stock or index for minutes or days.
The CAPE ratio can still be useful for traders as part of fundamental analysis as it provides an indication of whether market sentiment will be bullish or bearish. When you use the CAPE ratio, it’s important to remember that it’s based on historical data, which is no guarantee of future performance.
Want to start trading or investing? Open an account with us and be ready to deal on live markets in minutes.
This information has been prepared by IG, a trading name of IG Limited. In addition to the disclaimer below, the material on this page does not contain a record of our trading prices, or an offer of, or solicitation for, a transaction in any financial instrument. IG accepts no responsibility for any use that may be made of these comments and for any consequences that result. No representation or warranty is given as to the accuracy or completeness of this information. Consequently any person acting on it does so entirely at their own risk. Any research provided does not have regard to the specific investment objectives, financial situation and needs of any specific person who may receive it. It has not been prepared in accordance with legal requirements designed to promote the independence of investment research and as such is considered to be a marketing communication. Although we are not specifically constrained from dealing ahead of our recommendations we do not seek to take advantage of them before they are provided to our clients.
CFDs are a leveraged products. CFD trading may not be suitable for everyone and can result in losses that exceed your initial deposit, so please ensure that you fully understand the risks involved.

Discover how to trade the markets
Explore the range of markets you can trade – and learn how they work – with IG Academy's free ’introducing the financial markets’ course.
