Weaker US dollar helped US indices regain some footing: DJIA, Nikkei 225, GBP/USD
Major US indices started the week on a positive footing, as a retreat in the US dollar was tapped on for some slight relief.


Market Recap
Major US indices started the week on a positive footing, as a retreat in the US dollar was tapped on for some slight relief. The lower-than-expected US durable goods orders (-4.5% month-on-month versus -4% forecast) was the catalyst to pull the US dollar lower, potentially on some hopes that weaker economic conditions could relieve some pricing pressures in the economy. The ‘bad news for the economy is good news for the markets’ narrative could be swinging back in focus, following recent upside surprises in US inflation figures. Rate hike expectations saw little changed overnight, while the mid-day paring of gains among US indices suggested that a tone of caution is still in place. The higher highs and higher lows for the US dollar remains intact, therefore it could take much more (likely a move back below 103.12) to provide greater conviction of a reversal in trend to the downside.
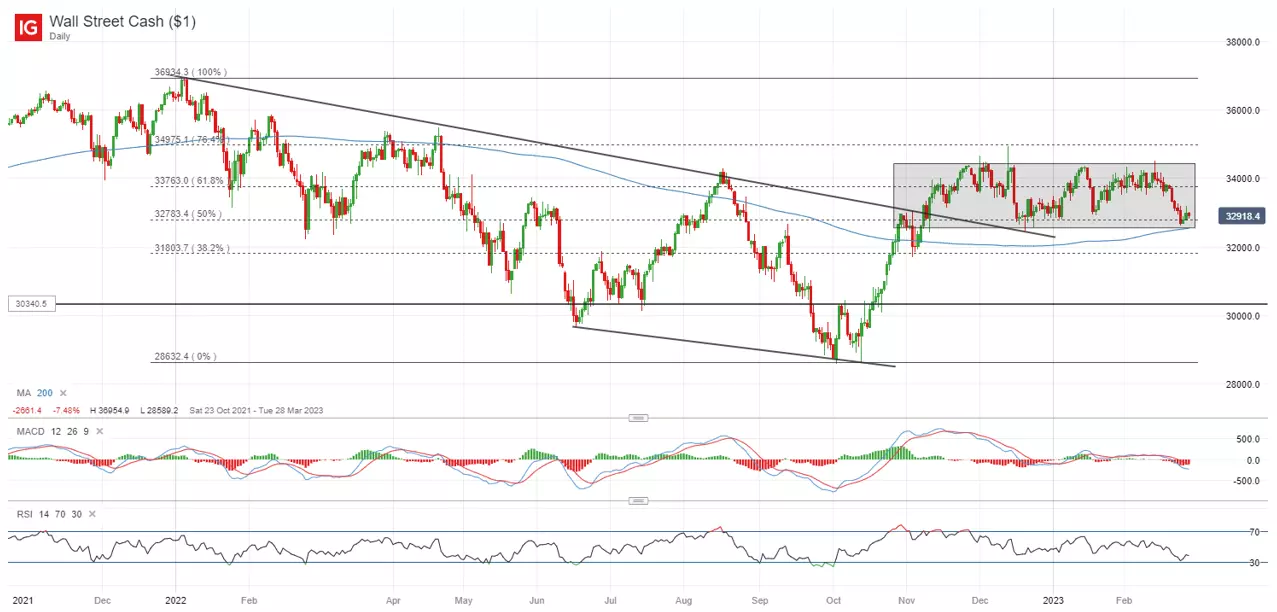
Nevertheless, risk sentiments are attempting to stabilise with the S&P 500 and Nasdaq 100 index hanging just above their respective key 200-day moving averages (MA). The DJIA is also in a precarious position, hanging at the lower base of a consolidation pattern in place since November last year. It has managed to defend the support line for now, but any breakdown of the 32,600 level over the coming days could further support a shift in trend to the downside, and pave the way towards the 31,800 level next.
Asia Open
Asian stocks look set for a positive open, with Nikkei +0.42%, ASX +0.48% and KOSPI +0.85% at the time of writing. A weaker US dollar overnight is providing some room for relief, but the more measured gains suggest that there are still some doubts on whether the US dollar weakness can continue in light of the recent upward trend. Economic data this morning revealed a sharper-than-expected decline in Japan’s factory output (-4.6% month-on-month versus -2.6% forecast), while Japan’s retail sales are still the bright spot in the economy (+6.3% year-on-year versus +4.0% forecast). A delayed reopening continues to depend on strength in the services sector to cushion weaker global demand, along with supportive policies still in place at least over the next few months (until July that is).
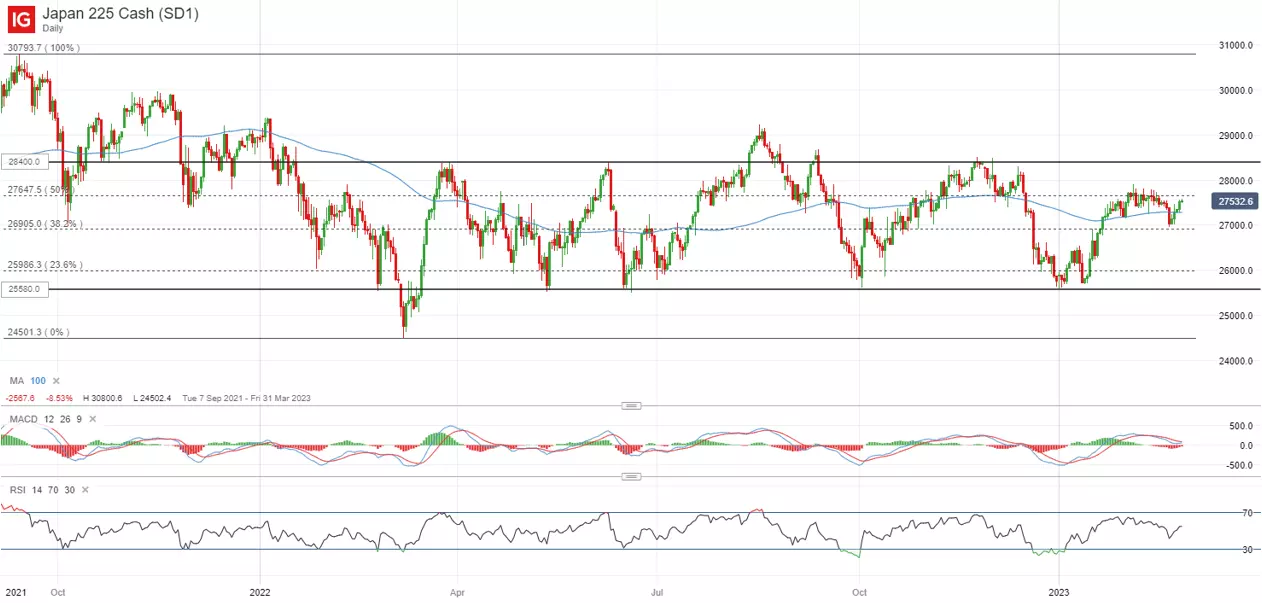
The Nikkei 225 index continues to trade in its longer-term ranging pattern, bouncing between the 25,580-28,400 range ever since the start of 2022. A false breakdown of both its 100-day and 200-day MA suggests that the bulls are attempting to retain control for now. Greater conviction could come from a move above the 27,800 level, where a previous consolidation zone stands. A break above the 27,800 level could potentially pave the way to retest the 28,400 once more.
On the watchlist: Double-top formation on watch for GBP/USD
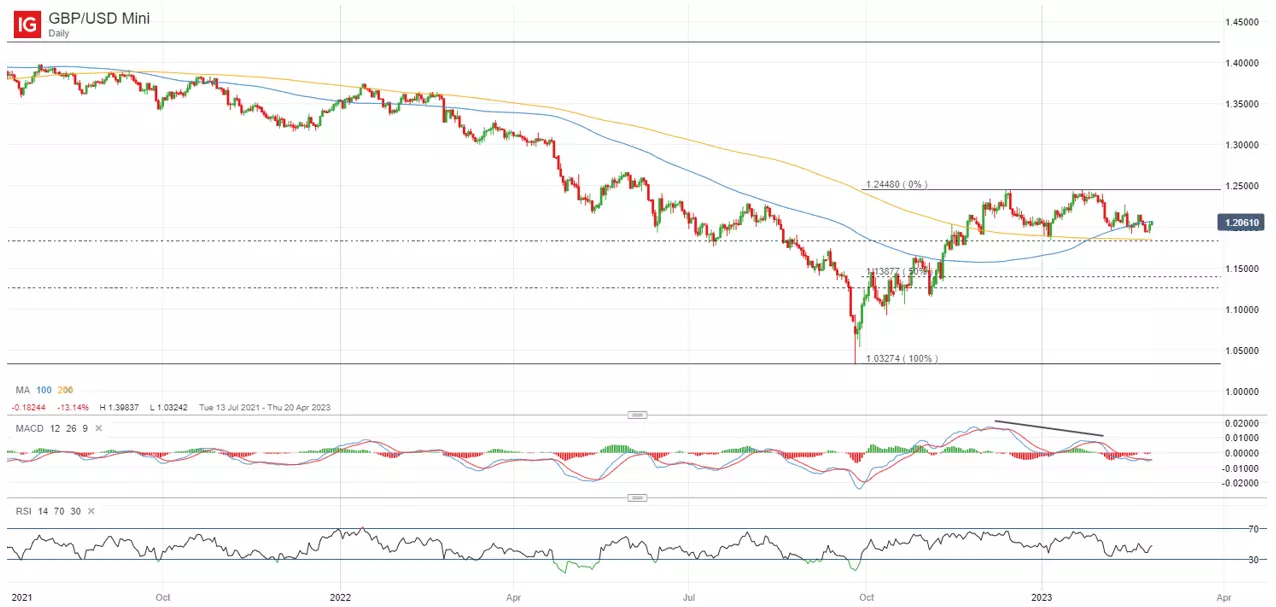
The GBP/USD has been stuck in a double-top formation since November last year, with its upward momentum seeing some easing, as reflected from the lower highs on moving average convergence/divergence (MACD). The overall upward trend may still be retained, but only seemingly if the 1.183 level holds up ahead. This level is where the double-top neckline stands in coincidence with its 200-day MA. On the weekly chart, a retest of this level was also marked by the formation of a bullish pin bar at the start of the year, which reflected some dip-buying activities. Any breakdown of the level could pave the way to retest the 1.125 level next, based on the neckline projection and a key Fibonacci retracement level.
Monday: DJIA +0.22%; S&P 500 +0.31%; Nasdaq +0.63%, DAX +1.13%, FTSE +0.72%
This information has been prepared by IG, a trading name of IG Limited. In addition to the disclaimer below, the material on this page does not contain a record of our trading prices, or an offer of, or solicitation for, a transaction in any financial instrument. IG accepts no responsibility for any use that may be made of these comments and for any consequences that result. No representation or warranty is given as to the accuracy or completeness of this information. Consequently any person acting on it does so entirely at their own risk. Any research provided does not have regard to the specific investment objectives, financial situation and needs of any specific person who may receive it. It has not been prepared in accordance with legal requirements designed to promote the independence of investment research and as such is considered to be a marketing communication. Although we are not specifically constrained from dealing ahead of our recommendations we do not seek to take advantage of them before they are provided to our clients.
CFDs are a leveraged products. CFD trading may not be suitable for everyone and can result in losses that exceed your initial deposit, so please ensure that you fully understand the risks involved.

Act on stock opportunities today
Go long or short on thousands of international stocks with CFDs.
- Get full exposure for a comparatively small deposit
- Trade on spreads from just 0.1%
- Get greater order book visibility with direct market access
See opportunity on a stock?
Try a risk-free trade in your demo account, and see whether you’re on to something.
- Log in to your demo
- Try a risk-free trade
- See whether your hunch pays off
See opportunity on a stock?
Don’t miss your chance – upgrade to a live account to take advantage.
- Trade a huge range of popular stocks
- Analyse and deal seamlessly on fast, intuitive charts
- See and react to breaking news in-platform
See opportunity on a stock?
Don’t miss your chance. Log in to take advantage while conditions prevail.
Live prices on most popular markets
- Forex
- Shares
- Indices
Prices above are subject to our website terms and agreements. Prices are indicative only. All shares prices are delayed by at least 15 mins.

