How will Middle East geopolitical risks impact Wall Street this week?
US equities tumbled Friday as Israel's missile strikes on Iran sparked geopolitical concerns, though S&P 500 futures recover ahead of Thursday's pivotal Fed rate decision. Oil supply risks and tariff uncertainties complicate the central bank's policy outlook.


Wall Street reacts to Middle East tensions as Fed rate decision looms
United States (US) stocks fell sharply on Friday as Iran retaliated against Israel with missile strikes, while traders now focus on this week's Federal Reserve (Fed) interest rate decision amid geopolitical uncertainty. The US 500 (S&P 500) futures suggest recovery as Israel's strategic strikes show early success.
US stocks retreat on geopolitical tensions
US stocks closed sharply lower on Friday as risk appetite evaporated after Iran retaliated against Israel's initial attack with missile and drone strikes. For the week, the Wall Street (Dow Jones) slipped 1.32%, the US Tech 100 (Nasdaq 100) fell 0.60%, and the US 500 lost 0.39%.
While the situation in the Middle East remains fluid, US US 500 equity futures are trading about 0.95% higher this morning at 6036, likely buoyed by Israel's early success in its counter-strikes targeting Iran's nuclear facilities, air defences, missile production, and military leaders to cripple strategic capabilities. Additionally, while Israel has targeted Iranian energy infrastructure used domestically in its response, it has refrained from targeting key Iranian oil export infrastructure.
Oil supply concerns add market complexity
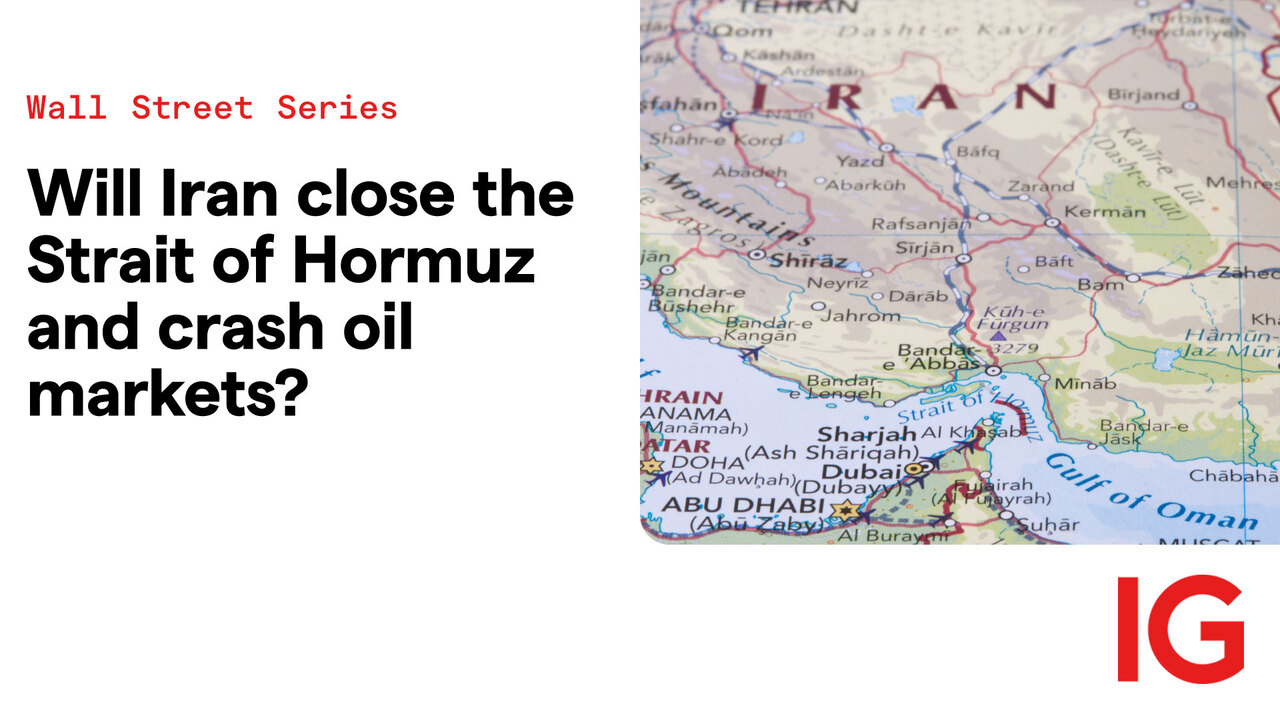
Iran only produces about 3.5% of the global crude oil supply. However, there are fears that Iran may close the Strait of Hormuz in response to Israel's strikes, which would impact oil trade, as it is the primary route for oil exports from major Organisation of the Petroleum Exporting Countries (OPEC) producers like Saudi Arabia, Iraq, the UAE, and Kuwait. This is viewed as a measure of last resort by Iran, as it would affect its main customers, China and India, and increase the likelihood of US military intervention.
The knock-on impact of higher energy prices is that they will slow growth and cause headline inflation to rise. While central banks would prefer to overlook a temporary spike in energy prices, if they remain elevated for a long period, it may feed through into higher core inflation as businesses pass on higher transport and production costs.
This would hamper central banks' ability to cut rates to cushion the anticipated growth slowdown from President Trump's tariffs, which adds another variable for the Fed to consider when it meets to discuss interest rates this week.
FOMC interest rate decision
Date: Thursday, 19 June at 4.00am AEST
At the last Federal Open Market Committee (FOMC) meeting in early May, the Federal Reserve kept the Fed Funds rate on hold at 4.25% - 4.50%. The Fed cited increasing uncertainty about the economic outlook, noting that 'the risks of higher unemployment and higher inflation have risen.' Fed Chair Powell also expressed optimism, stating, 'The economy itself is still in solid shape,' and indicating that the Fed doesn't need to rush to cut rates while it takes time to assess the impact of President Trump's tariffs on the economy.
Since the May meeting, while the soft data, including consumer and business surveys, has been weak, the hard data, including last week's non-farm payrolls report, has held up better than expected given the impact of tariff and trade disruptions. On inflation, the Fed's preferred measure, the core PCE price index, most recently at 2.5%, has yet to show any signs of tariff-related inflationary concerns.
Considering this, the Fed is expected to keep the Fed Funds rate unchanged at 4.25% - 4.50%, reflecting its cautious 'wait and see' approach. Fed Chair Jerome Powell is expected to emphasise data dependency in his press conference, avoiding firm commitments and resisting political pressure from President Donald Trump to cut rates. The US rates market finished last week pricing in an 83% chance of a 25 basis point (bp) Fed rate cut for September, with a cumulative 54 bp of Fed rate cuts priced by year-end.
Fed funds rate chart

US Tech 100 technical analysis
Post the US Tech 100's surge higher on 12 May, we have been working with the view that the rally in the US Tech 100 from the 21 April 17,592 low is a Wave III (Elliott Wave) that should be followed by a Wave IV pullback.
While it is possible that a Wave III high is in place at last week's 22,041 print, a break of support at 21,500 - 21,450 would confirm this and that Wave IV is unfolding back towards support coming from the 200-day moving average (MA) 20,800 - 20,500 area. Providing this support band holds it should then be followed by another leg higher for Wave V.
Aware that a sustained break below the 200-day MA would be an indication of a possible double top formation and warn that a deeper pullback is underway.
US Tech 100 daily chart

US 500 technical analysis
Post the US 500's surge higher on 12 May, we have been working with the view that the rally in the US 500 from the 21 April 5101 low is a Wave III (Elliott Wave) that should soon be followed by a Wave IV pullback.
While it is possible that a Wave III high is in place at last week's 6059 print, further downside follow-through is needed to confirm this and that Wave IV is unfolding. The initial target for the Wave IV is the support coming from the 200-day MA 5800 - 5770 area. Providing this support band holds it should then be followed by another leg higher for Wave V.
Aware that a sustained break below the 5800 - 5770 area would warn that a deeper pullback is underway.
US 500 daily chart

- Source: TradingView. The figures stated are as of 16 June 2025. Past performance is not a reliable indicator of future performance. This report does not contain and is not to be taken as containing any financial product advice or financial product recommendation.
Important to know
This information has been prepared by IG, a trading name of IG Limited. In addition to the disclaimer below, the material on this page does not contain a record of our trading prices, or an offer of, or solicitation for, a transaction in any financial instrument. IG accepts no responsibility for any use that may be made of these comments and for any consequences that result. No representation or warranty is given as to the accuracy or completeness of this information. Consequently any person acting on it does so entirely at their own risk. Any research provided does not have regard to the specific investment objectives, financial situation and needs of any specific person who may receive it. It has not been prepared in accordance with legal requirements designed to promote the independence of investment research and as such is considered to be a marketing communication. Although we are not specifically constrained from dealing ahead of our recommendations we do not seek to take advantage of them before they are provided to our clients.
CFDs are a leveraged products. CFD trading may not be suitable for everyone and can result in losses that exceed your initial deposit, so please ensure that you fully understand the risks involved.
Ready to open an IG account?
Start your trading journey now
Connect with us
Disclaimers
- CFDs are complex instruments and come with a high risk of losing money rapidly due to leverage. You should consider whether you understand how CFDs work, and whether you can afford to take the high risk of losing your money. Professional Clients can lose more than they deposit.
- The value of shares and ETFs bought through an IG stock trading account can fall as well as rise, which could mean getting back less than you originally put in. Please ensure you fully understand the risks and take care to manage your exposure.
- IG does not issue advice, recommendations or opinions in relation to acquiring, holding or disposing of a CFD. IG is not a financial advisor and all services are provided on an execution-only basis. This communication is not an offer or solicitation to enter into a transaction and shall not be construed as such.
- IG is a trading name of IG Limited a company registered at 2702 & 2703 Level 27, Tower 2, Al Fattan Currency House, DIFC, Dubai, United Arab Emirates. IG is authorised and regulated by the Dubai Financial Services Authority (DFSA) under reference No. F001780.
- The information on this site is not directed at residents of the United States, Belgium or any particular country outside the UAE and is not intended for distribution to, or use by, any person in any country or jurisdiction where such distribution or use would be contrary to local law or regulation.
