Weaker US dollar helped US indices regain some footing: DJIA, Nikkei 225, GBP/USD
Major US indices started the week on a positive footing, as a retreat in the US dollar was tapped on for some slight relief.


Market Recap
Major US indices started the week on a positive footing, as a retreat in the US dollar was tapped on for some slight relief. The lower-than-expected US durable goods orders (-4.5% month-on-month versus -4% forecast) was the catalyst to pull the US dollar lower, potentially on some hopes that weaker economic conditions could relieve some pricing pressures in the economy. The ‘bad news for the economy is good news for the markets’ narrative could be swinging back in focus, following recent upside surprises in US inflation figures. Rate hike expectations saw little changed overnight, while the mid-day paring of gains among US indices suggested that a tone of caution is still in place. The higher highs and higher lows for the US dollar remains intact, therefore it could take much more (likely a move back below 103.12) to provide greater conviction of a reversal in trend to the downside.
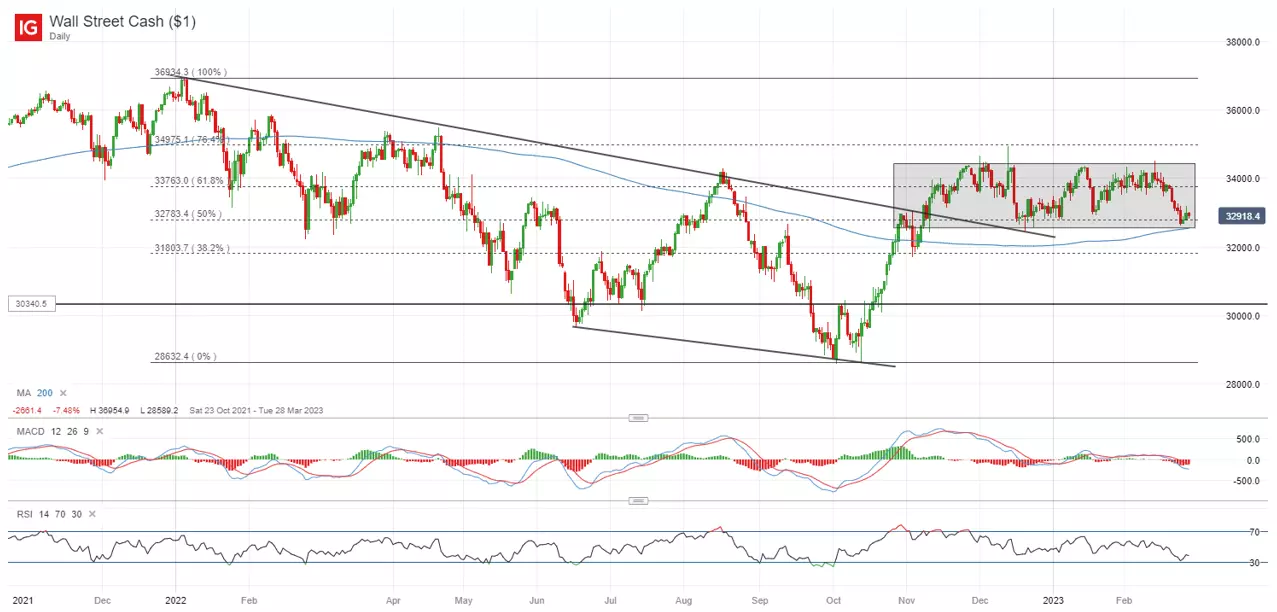
Nevertheless, risk sentiments are attempting to stabilise with the S&P 500 and Nasdaq 100 index hanging just above their respective key 200-day moving averages (MA). The DJIA is also in a precarious position, hanging at the lower base of a consolidation pattern in place since November last year. It has managed to defend the support line for now, but any breakdown of the 32,600 level over the coming days could further support a shift in trend to the downside, and pave the way towards the 31,800 level next.
Asia Open
Asian stocks look set for a positive open, with Nikkei +0.42%, ASX +0.48% and KOSPI +0.85% at the time of writing. A weaker US dollar overnight is providing some room for relief, but the more measured gains suggest that there are still some doubts on whether the US dollar weakness can continue in light of the recent upward trend. Economic data this morning revealed a sharper-than-expected decline in Japan’s factory output (-4.6% month-on-month versus -2.6% forecast), while Japan’s retail sales are still the bright spot in the economy (+6.3% year-on-year versus +4.0% forecast). A delayed reopening continues to depend on strength in the services sector to cushion weaker global demand, along with supportive policies still in place at least over the next few months (until July that is).
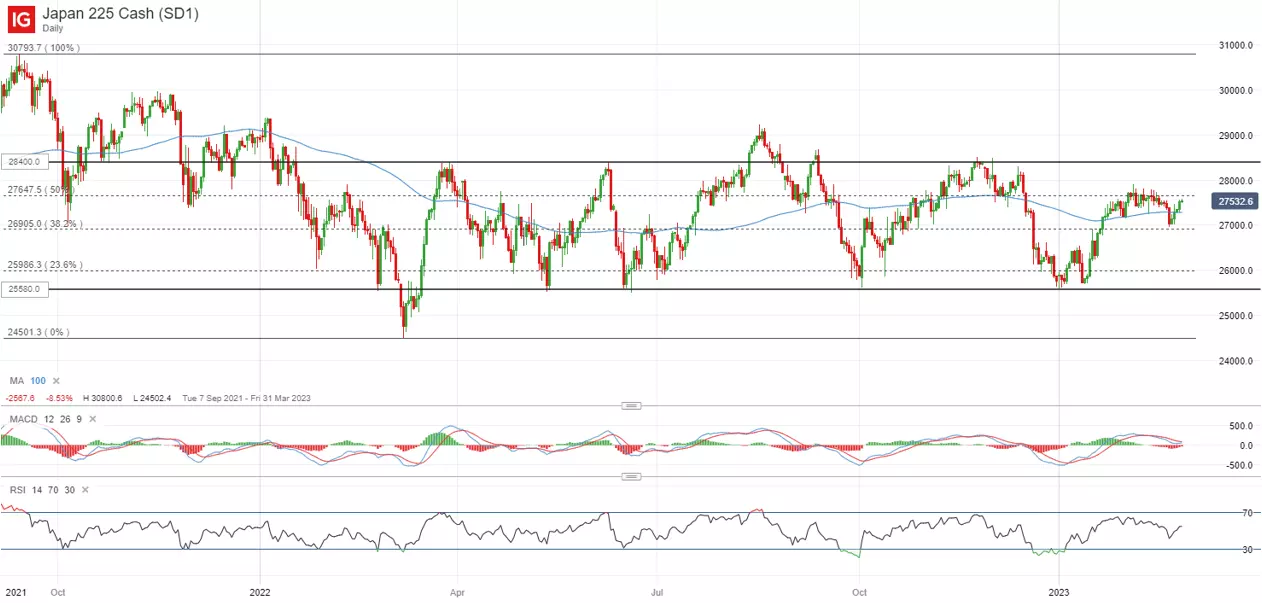
The Nikkei 225 index continues to trade in its longer-term ranging pattern, bouncing between the 25,580-28,400 range ever since the start of 2022. A false breakdown of both its 100-day and 200-day MA suggests that the bulls are attempting to retain control for now. Greater conviction could come from a move above the 27,800 level, where a previous consolidation zone stands. A break above the 27,800 level could potentially pave the way to retest the 28,400 once more.
On the watchlist: Double-top formation on watch for GBP/USD
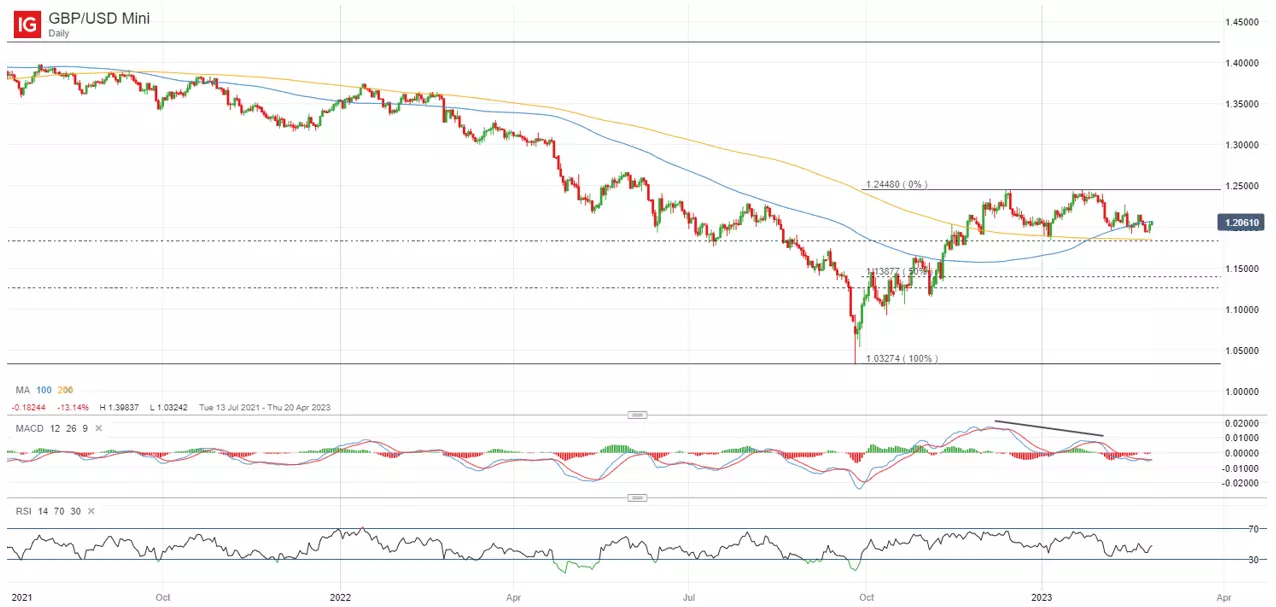
The GBP/USD has been stuck in a double-top formation since November last year, with its upward momentum seeing some easing, as reflected from the lower highs on moving average convergence/divergence (MACD). The overall upward trend may still be retained, but only seemingly if the 1.183 level holds up ahead. This level is where the double-top neckline stands in coincidence with its 200-day MA. On the weekly chart, a retest of this level was also marked by the formation of a bullish pin bar at the start of the year, which reflected some dip-buying activities. Any breakdown of the level could pave the way to retest the 1.125 level next, based on the neckline projection and a key Fibonacci retracement level.
Monday: DJIA +0.22%; S&P 500 +0.31%; Nasdaq +0.63%, DAX +1.13%, FTSE +0.72%
IGA, may distribute information/research produced by its respective foreign affiliates within the IG Group of companies pursuant to an arrangement under Regulation 32C of the Financial Advisers Regulations. Where the research is distributed in Singapore to a person who is not an Accredited Investor, Expert Investor or an Institutional Investor, IGA accepts legal responsibility for the contents of the report to such persons only to the extent required by law. Singapore recipients should contact IGA at 6390 5118 for matters arising from, or in connection with the information distributed.
The information/research herein is prepared by IG Asia Pte Ltd (IGA) and its foreign affiliated companies (collectively known as the IG Group) and is intended for general circulation only. It does not take into account the specific investment objectives, financial situation, or particular needs of any particular person. You should take into account your specific investment objectives, financial situation, and particular needs before making a commitment to trade, including seeking advice from an independent financial adviser regarding the suitability of the investment, under a separate engagement, as you deem fit.
No representation or warranty is given as to the accuracy or completeness of this information. Consequently, any person acting on it does so entirely at their own risk. Please see important Research Disclaimer.
Please also note that the information does not contain a record of our trading prices, or an offer of, or solicitation for, a transaction in any financial instrument. Any views and opinions expressed may be changed without an update.

Seize a share opportunity today
Go long or short on thousands of international stocks.
- Increase your market exposure with leverage
- Get spreads from just 0.1% on major global shares
- Trade CFDs straight into order books with direct market access
Live prices on most popular markets
- Forex
- Shares
- Indices
See more forex live prices
See more shares live prices
Prices above are subject to our website terms and agreements. Prices are indicative only. All shares prices are delayed by at least 15 mins.
See more indices live prices
Prices above are subject to our website terms and agreements. Prices are indicative only. All shares prices are delayed by at least 20 mins.
