Wall Street on a breather as Apple failed to commit to all-time high: Russell 2000, AUD/USD, Silver
A mixed showing in Wall Street eventually saw the Nasdaq pare its initial gains by the close, partly as optimism around Apple’s share price fizzled.


Market Recap
A mixed showing in Wall Street eventually saw the Nasdaq pare its initial gains by the close, partly as optimism around Apple’s share price fizzled, following the unveiling of its augmented-reality headset, Vision Pro. The company’s share price briefly pushed to a new all-time high intraday but failed to find the commitment for a confirmation close. With overbought technical conditions and a rejection of its all-time high, any follow-through weakness from the index’s heavyweight (Apple) could mean downward pressure on the wider markets.
On the economic data front, further cracks in US economic conditions were unveiled with a downside surprise in the US Institute for Supply Management (ISM) services Purchasing Managers’ Index (PMI) read (50.3 versus 52.5 forecast). While the moderation in its prices sub-index looks promising on the inflation front, the trade-off for growth is clearly presented with a decline in the services employment sub-index into contractionary territory while new orders slowed significantly. April’s factory orders underperformed as well (0.4% versus 0.8% forecast).
Weaker data brought Treasury yields lower, prompting the US dollar to pare its initial gains. A lacklustre US dollar is positive news for gold prices, which defended its key trendline support at the US$1,940 level, at least for now. Aside, optimism in oil prices on a lower-supply outlook largely saw some fading.
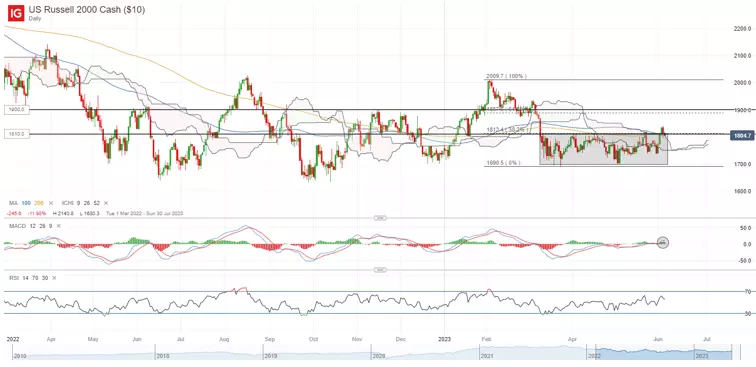
Having traded in a range since March this year, the break of the upper bound in the Russell 2000 index last week could reflect greater control from buyers but the new resistance-turned-support 1,800 level will have to see some defending ahead. Market breadth has been supportive for now, with the percentage of stocks above its 50-day moving average (MA) breaking to a new multi-month high. Any failure to defend the 1,800 level ahead could point to a potential false breakout scenario, which could draw some selling pressure in challenging the 1,740 level next.
Asia Open
Asian stocks look set for a downbeat open, with Nikkei -0.22%, ASX -0.72% and NZX -0.36% at the time of writing. South Korea markets are off for holiday.
The Reserve Bank of Australia (RBA) interest rate decision will be the central event today, with cash rate futures pricing for a rate pause (64% probability) at the upcoming meeting but still expecting an additional hike in subsequent meetings. This leans towards a hawkish-pause scenario, as untamed inflation in April failed to provide the much-needed conviction for an extended pause.
Any hints towards the terminal rate will be on the lookout. Current market pricing is leaning towards the rate of 4.1% (current rate at 3.85%), which still suggests that we are heading towards the final phase of the tightening cycle. Any pushback on that front will likely prompt a hawkish recalibration in those expectations and be supportive of the AUD in the near term.
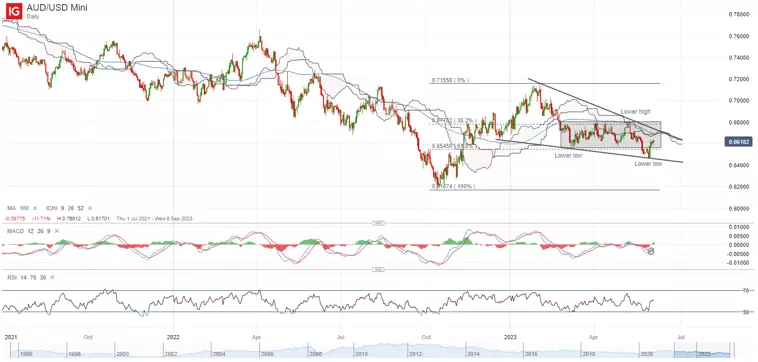
Having broken below the lower bound of a rectangle pattern (consolidation zone) in late-May, the AUD/USD is quick to reclaim the 0.656 level last week, with a bullish moving average convergence/divergence (MACD) crossover on the daily chart pointing to a potential turnaround in short-term momentum. That said, the pair seems to be trading within a falling wedge pattern on lower highs and lower lows since February this year, which could still leave a downward bias in place, until a series of resistance are overcome. This may include the upper wedge trendline resistance, its Ichimoku cloud, its 100-day moving average and the upper bound of its consolidation pattern, which could force the formation of another lower high.
On the watchlist: Silver prices’ formation of bullish pin bar on retest of 100-day MA
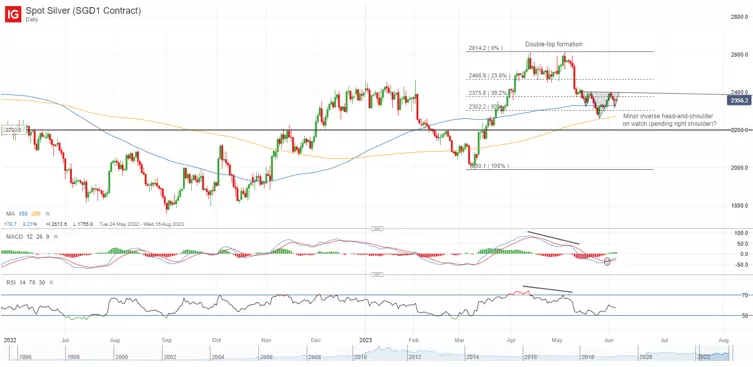
A slight breather in the US dollar has translated to some resilience in silver prices overnight, as a retest of its 100-day MA was met with the formation of a bullish pin bar, reflecting signs of some near-term dip buying. Any upside at this point could potentially aid to complete the right shoulder of a minor inverse head-and-shoulder pattern in place since mid-May this year, although for now, it is still premature to conclude that the pattern will be formed.
The US$24.00 level will be the key resistance to overcome to provide greater conviction for the bulls. Prices have failed to move past the level on two occasions over the past month. Reclaiming this level may also mark a break of the neckline of the inverse head-and-shoulder pattern, potentially paving the way towards the US$24.70 level next.
Monday: DJIA -0.59%; S&P 500 -0.20%; Nasdaq -0.09%, DAX -0.54%, FTSE -0.10%
IGA, may distribute information/research produced by its respective foreign affiliates within the IG Group of companies pursuant to an arrangement under Regulation 32C of the Financial Advisers Regulations. Where the research is distributed in Singapore to a person who is not an Accredited Investor, Expert Investor or an Institutional Investor, IGA accepts legal responsibility for the contents of the report to such persons only to the extent required by law. Singapore recipients should contact IGA at 6390 5118 for matters arising from, or in connection with the information distributed.
The information/research herein is prepared by IG Asia Pte Ltd (IGA) and its foreign affiliated companies (collectively known as the IG Group) and is intended for general circulation only. It does not take into account the specific investment objectives, financial situation, or particular needs of any particular person. You should take into account your specific investment objectives, financial situation, and particular needs before making a commitment to trade, including seeking advice from an independent financial adviser regarding the suitability of the investment, under a separate engagement, as you deem fit.
No representation or warranty is given as to the accuracy or completeness of this information. Consequently, any person acting on it does so entirely at their own risk. Please see important Research Disclaimer.
Please also note that the information does not contain a record of our trading prices, or an offer of, or solicitation for, a transaction in any financial instrument. Any views and opinions expressed may be changed without an update.

Seize a share opportunity today
Go long or short on thousands of international stocks.
- Increase your market exposure with leverage
- Get spreads from just 0.1% on major global shares
- Trade CFDs straight into order books with direct market access
Live prices on most popular markets
- Forex
- Shares
- Indices
See more forex live prices
See more shares live prices
Prices above are subject to our website terms and agreements. Prices are indicative only. All shares prices are delayed by at least 15 mins.
See more indices live prices
Prices above are subject to our website terms and agreements. Prices are indicative only. All shares prices are delayed by at least 20 mins.
