Wall Street: Indices snap a three-week losing streak post-Jackson Hole
Fed Chair Powell's remarks at Jackson Hole brought relief to US equity markets, prompting a positive response and focus now shifts to the Core PCE price index and Non-Farm payrolls data.
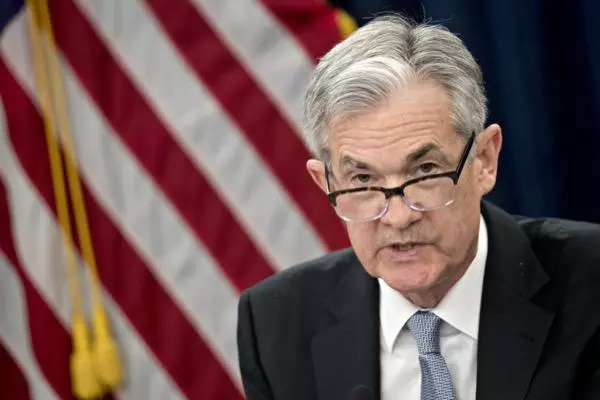

US equity markets finished higher on Friday after Fed Chair Powell's speech at Jackson Hole was mainly as expected, noting that the Fed was data-dependent and could lift rates again "if appropriate".
Following the Fed chair's speech, the odds of a rate hike in September remained unchanged at a low 20%. However, the rates market is now ~46% priced for a 25bp rate hike in November, up from ~22% three weeks ago.
Aside from the higher yields at the front end, Fed Chair Powell's tone at Jackson Hole appeared to have struck the right note for US equity markets. The Nasdaq and the S&P 500 snapped their three-week losing streaks, closing 1.68% and 0.82% higher on the week, respectively.
This week, the key events on the calendar for US markets are the Fed's preferred measure of inflation, the Core PCE Price Index on Thursday and Non-Farm Payrolls and ISM on Friday.
What is expected from Non-Farm Payrolls?
Friday, 1st September at 10:30 pm AEST
The current consensus is for 168,000 job gains in August, slightly lower than the 187,000 in July, while the unemployment rate is expected to stay at 3.5%. Behind the decreased rate of job growth was the bankruptcy of transport company Yellow Corp, which left 30,000 workers without jobs during the survey period.
US wage growth is anticipated to moderate to 0.3% month-on-month in August from 0.4%, which would result in the annual rate easing to 4.3% year-on-year from 4.4%. However, at 4.3%, the rate remains well above the 3-3.5% level thought to be consistent with the Fed's 2% inflation target without a rise in productivity. The participation rate is projected to remain unchanged at 62.6%.
A softer reading from the upcoming jobs report would provide more flexibility for the Fed to remain on hold beyond September. The rates market is pricing the Fed Funds rate to stay above 5% during the first half of 2024, with about 100 basis points of rate cuts in the second half of next year.
US unemployment rate chart

S&P 500 technical analysis
In last Monday's update, we wrote:
"The correction in the S&P 500 from the 4634.50 July high made fresh lows on Friday at 4350 before some squaring up took place ahead of the weekend. While the recovery could extend ahead of Jackson Hole, the downside correction has further to go."
If the S&P 500 continues to stay below the resistance level at 4490/4500, which corresponds to the highs observed in June, July, and the previous week, there is a likelihood for the index to further extend its corrective decline. This decline could potentially lead towards the uptrend support located at 4240 in the forthcoming weeks.
Aware that should the S&P 500 see a sustained close above 4500, it would warn that the correction is likely complete and of a retest of the July 4634.50 high.
S&P 500 daily chart

Nasdaq technical analysis
The perspective outlined in the previous Monday's update regarding a pre-Jackson Hole bounce, played out effectively, reaching a peak of 15,418 before subsequently retreating towards the trend channel support on Thursday.
Providing the Nasdaq remains above trend channel support 14,600 area, it keeps the uptrend intact and, with that, a chance of a retest and break of the 16,062 high into year-end.
Aware that if the Nasdaq loses support at 14,600 on a sustained basis, it will likely trigger a deeper decline towards 14,000.
Nasdaq daily chart

Dow Jones technical analysis
In last Monday's update we emphasised that the Dow Jones' pullback was nearing completion, under the condition that it maintained support around 34,100.
The view for this week is unchanged, and providing the Dow Jones remains above trend channel support of 34,100ish, it keeps the uptrend intact and, with that, a chance of a retest and break of the recent 35,679 high.
Aware that if the Dow Jones loses support at 34,100/00 followed by a sustained break of the 200-day moving average at 33,375, it would likely trigger a deeper decline towards 32,500.
Dow Jones daily chart

- TradingView: the figures stated are as of August 28, 2023. Past performance is not a reliable indicator of future performance. This report does not contain and is not to be taken as containing any financial product advice or financial product recommendation.
IGA, may distribute information/research produced by its respective foreign affiliates within the IG Group of companies pursuant to an arrangement under Regulation 32C of the Financial Advisers Regulations. Where the research is distributed in Singapore to a person who is not an Accredited Investor, Expert Investor or an Institutional Investor, IGA accepts legal responsibility for the contents of the report to such persons only to the extent required by law. Singapore recipients should contact IGA at 6390 5118 for matters arising from, or in connection with the information distributed.
The information/research herein is prepared by IG Asia Pte Ltd (IGA) and its foreign affiliated companies (collectively known as the IG Group) and is intended for general circulation only. It does not take into account the specific investment objectives, financial situation, or particular needs of any particular person. You should take into account your specific investment objectives, financial situation, and particular needs before making a commitment to trade, including seeking advice from an independent financial adviser regarding the suitability of the investment, under a separate engagement, as you deem fit.
No representation or warranty is given as to the accuracy or completeness of this information. Consequently, any person acting on it does so entirely at their own risk. Please see important Research Disclaimer.
Please also note that the information does not contain a record of our trading prices, or an offer of, or solicitation for, a transaction in any financial instrument. Any views and opinions expressed may be changed without an update.
Live prices on most popular markets
- Forex
- Shares
- Indices
See more forex live prices
See more shares live prices
Prices above are subject to our website terms and agreements. Prices are indicative only. All shares prices are delayed by at least 15 mins.
See more indices live prices
Prices above are subject to our website terms and agreements. Prices are indicative only. All shares prices are delayed by at least 20 mins.
