American Airlines Q3 earnings preview: what to expect amid downgraded projections and market volatility
With American Airlines slated to release its Q3 earnings on 19 October, the market braces for impact. From lowered earnings estimates to climbing operational costs and market sentiment, delve into what investors should watch for.


When will American Airlines announce its Q3 earnings?
American Airlines Group (NASDAQ:AAL) is scheduled to unveil its quarterly financial results on Thursday, 19 October, prior to the opening bell of the stock market.
What does 'The Street' expect from American Airlines' Q3 earnings?
After a bullish Q2 outlook, American Airlines has dramatically scaled back its Q3 earnings per share projections from an initial range of $0.85 to $0.95 to a revised estimate of just $0.20 to $0.30.
According to a consensus from analysts and brokers polled by Refinitiv as of October 16, 2023, the forthcoming Q3 results are anticipated to be:
- Revenue: $13.515 billion, marking a modest 0.39% YoY increase
- Earnings Per Share: $0.25, representing a significant 63.47% YoY decline
The airline has faced operational headwinds that have led to this downgrade in earnings forecasts. Key contributing factors include escalating fuel and labour expenses, coupled with muted demand. Notably, the company incurred a $230 million cost in August, settling with the Airline Pilots Association.

What should you know?
- American Airlines is set to unveil its quarterly earnings on October 19, amid a climate of reduced expectations for Q3 performance
- Both the company and financial analysts have lowered their forecasts for the quarter, attributing the downgrade to a combination of escalating fuel and labor expenses, as well as revised, softer demand projections
- Despite holding a 'neutral' broker rating, American Airlines' shares are trading below the company's long-term average price target
- Currently in oversold territory, the share price of American Airlines Group faces bearish prospects in the short to medium term.
Q3 2023 financial forecast overview
Netflix Inc. has recently provided insight into its financial forecast for the third quarter of 2023. As a prominent player in the entertainment sector, key financial metrics for the company include revenue growth and operating margin, which serves as a measure of profitability.
The company aims to accelerate revenue growth, expand operating margins, and generate increasing positive free cash flow. The market is likely to evaluate the forthcoming results against these metrics, as well as subscriber growth.
Confidence boost: the role of paid sharing
The company has conveyed heightened confidence in its financial outlook, owing to the successful roll-out of paid sharing. This initiative is projected to spur revenue growth in the latter half of 2023 as it is extended to nearly all remaining countries and continues to bolster the company's ad-supported plan.
Q3 2023 financial forecast
For Q3, the forecast indicates an expected revenue of $8.5 billion, marking a year-on-year increase of 7% on both a reported and currency-neutral basis. This represents a minor acceleration from Q2 2023's currency-neutral revenue growth rate of 6%. The revenue upswing in Q3 is anticipated to be propelled by an increase in average paid memberships.
Challenges: ARPU and price increases
However, the currency-neutral Average Revenue Per User (ARPU) is forecasted to remain flat or experience a slight dip year-on-year. This is attributed to the lapping of price hikes implemented in 2022 and the absence of price increases in the company's largest revenue markets since the first half of 2022. Earnings from advertising and additional member features are not yet substantial enough to counterbalance these elements.
Subscriber growth: Q3 vs. Q2
In terms of subscriber growth, Q3 2023 paid net additions are expected to align with Q2 2023 figures. The company anticipates a more significant acceleration in revenue growth during Q4 2023, driven by further monetisation of account sharing between households and a steady increase in advertising revenue.
Profitability: looking beyond revenue
On the profitability front, Netflix projects a Q3 operating income of $1.9 billion, up from $1.5 billion in Q3 2022, and an operating margin of 22%, an increase from 19% in the corresponding period last year. For the full year of 2023, the company is targeting an operating margin of between 18% and 20%, based on forex rates as of 1 January 2023, marking an uptick from 17.8% in FY 2022.
Strategic outlook: future growth strategies
Netflix is concentrated on fuelling growth and enhancing profitability through leveraged strategies such as paid sharing and advertising.
How to trade the American Airlines Q3 2023 results
Based on IG's TipRanks Smart Score, American Airlines Group is rated as a 'Hold,' featuring a long-term average price target of $16.17 per share as of October 16, 2023. While public sentiment leans bullish, it's noteworthy that hedge funds have been net sellers of the stock in the past quarter.
American Airlines smart score chart

American Airlines echnical analysis
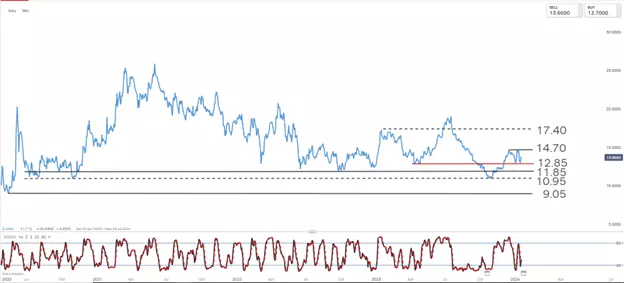
From a technical analysis standpoint, the momentum for the short-to-medium term trend is currently bearish, with the stock price testing the critical support level at 11.85. Should the price close below this level, the next downside target would be 10.95. In such a scenario, traders considering a short position might look at a close above 12.85 as a key stop-loss point.
The 10.95 mark becomes pivotal if tested, given the lack of substantial historical support until reaching the 9.05 level.
For those traders inclined toward a long position, a bounce back from the current oversold status and a closing price above the 12.85 resistance level would be the indicators for potentially establishing new long positions.
American Airlines daily chart
IGA, may distribute information/research produced by its respective foreign affiliates within the IG Group of companies pursuant to an arrangement under Regulation 32C of the Financial Advisers Regulations. Where the research is distributed in Singapore to a person who is not an Accredited Investor, Expert Investor or an Institutional Investor, IGA accepts legal responsibility for the contents of the report to such persons only to the extent required by law. Singapore recipients should contact IGA at 6390 5118 for matters arising from, or in connection with the information distributed.
The information/research herein is prepared by IG Asia Pte Ltd (IGA) and its foreign affiliated companies (collectively known as the IG Group) and is intended for general circulation only. It does not take into account the specific investment objectives, financial situation, or particular needs of any particular person. You should take into account your specific investment objectives, financial situation, and particular needs before making a commitment to trade, including seeking advice from an independent financial adviser regarding the suitability of the investment, under a separate engagement, as you deem fit.
No representation or warranty is given as to the accuracy or completeness of this information. Consequently, any person acting on it does so entirely at their own risk. Please see important Research Disclaimer.
Please also note that the information does not contain a record of our trading prices, or an offer of, or solicitation for, a transaction in any financial instrument. Any views and opinions expressed may be changed without an update.

Explore the markets with our free course
Discover and learn how the range of markets you can trade on with IG Academy's online course – ‘Introducing the financial markets’.
Put learning into action
Try out what you’ve learned in this shares strategy article risk-free in your demo account.
Ready to trade shares?
Put the lessons in this article to use in a live account – upgrading is quick and easy.
- Trade on over 10,000 popular global stocks
- Protect your capital with risk management tools
- React to breaking news with out-of-hours trading on 70 key US stocks
Inspired to trade?
Put your new knowledge into practice. Log in to your account now.
Live prices on most popular markets
- Forex
- Shares
- Indices
See more forex live prices
See more shares live prices
Prices above are subject to our website terms and agreements. Prices are indicative only. All shares prices are delayed by at least 15 mins.
See more indices live prices
Prices above are subject to our website terms and agreements. Prices are indicative only. All shares prices are delayed by at least 20 mins.
