Tug-of-war in market sentiments as FOMC meeting gets under way: S&P 500, AUD/USD, Copper
De-risking in the US equity markets continues to take place overnight, as economic data and downbeat profit guidance from Walmart provided little catalysts for markets to cheer.

Market Recap
De-risking in the US equity markets continues to take place overnight (DJIA -0.71%; S&P 500 -1.15%; Nasdaq -1.87%), as economic data and downbeat profit guidance from Walmart provided little catalysts for markets to cheer. US retailers were dragged sharply lower, with Amazon’s share price down more than 5%, following Walmart’s 7% plunge in share price. Consumer spending outlook were clearly being put into question, with some signs of a pullback in discretionary spending serving as the trade-off for high inflationary pressures, while a second straight month of underperformance in US consumer confidence data (95.7 versus 97.2 forecast) added to the cloudy outlook. To top it off, the International Monetary Fund (IMF) has cut global growth forecast to 3.2% for 2022 from the 3.6% forecast back in April, pointing to the third downward revision this year.
The bright spot for risk sentiments comes after-market however, with earnings releases out from Alphabet and Microsoft. Both tech giants missed its top and bottom-line for the recent quarter, but with the companies’ share prices down close to 30% from its all-time peak, market watchers were sourcing for any display of resilience to tap on for some relief. That was presented with Microsoft sticking to its previous forward guidance, where a double-digit growth forecast for revenue and operating income growth in 2023 fiscal year seek to push back against economic growth concerns. The catalyst for Alphabet came from its outperformance for Google search ads, suggesting that it is better-positioned to weather any downturn in ad spending compared to Snap and Twitter.
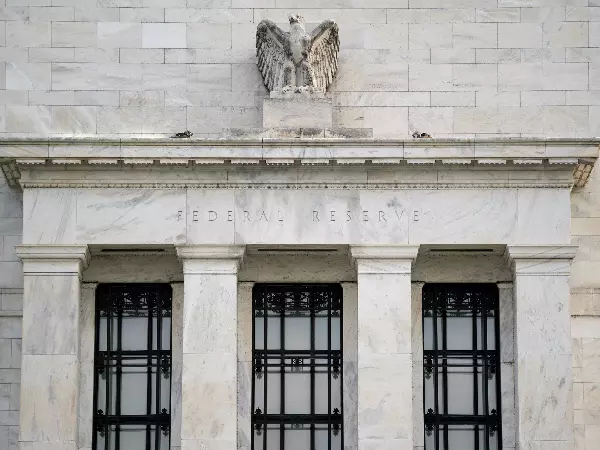
Overall, these still kept hopes of a continuation of the recent rally alive, with the Federal Open Market Committee (FOMC) meeting closely watched as the key driver for sentiments next. For the S&P 500, a previous resistance has now served as near-term support at the 3,910 level, as the index seeks to form a new higher low to retain its upward bias. Resistance ahead will stand at the key 4,000 psychological level, where the neckline of a previous head-and-shoulder pattern lies in place.

Asia Open
Asian stocks look set for a muted open, with Nikkei -0.09%, ASX +0.04% and KOSPI -0.26% at the time of writing. The Asia session may provide a first-hand indication of how market participants are digesting the overnight Wall Street sell-off with some recovery in risk appetite after-market, with the muted moves suggesting some indecision for now. The wait-and-see sentiments could also play out as market participants refrain from taking on excessive risks ahead of the key FOMC meeting outcome ahead.
On the economic calendar, inflation figures from Australia will be on watch, with expectations for a further pull-ahead in pricing pressures for quarter two (Q2) (6.2% forecast versus 5.1% in Q1). Previous round of tightening from the Reserve Bank of Australia (RBA) was met with another 50 basis-point (bp) rate hike but with Australia’s unemployment rate recently coming in at its lowest level in 48 years, a firm inflation reading may bring about talks of a more aggressive 75 bp hike on the table.
The risk-sensitive AUD/USD pair has broken out of its descending channel pattern last week, in line with the improved risk environment. That said, a bearish divergence at the moving average convergence divergence (MACD) indicator on the four-hour chart suggests lesser conviction with each peak formation, with the need for fresh catalysts to spur another move higher. Any upside surprise in Australia’s inflation or a less-hawkish FOMC meeting outcome ahead may potentially be looked upon as key tailwinds for the currency pair.

On the watchlist: Copper prices facing resistance test at US$7,700 level
Copper prices has fallen sharply by as much as 28% since June, with forward-looking growth concerns serving as the main culprit and driving market watchers to price for an impending demand moderation. This seems to outweigh the current improving demand picture in China, with the country reinforcing an infrastructure push to lift growth. On the technical front, coming after the heavy sell-off over the past two months, a bullish crossover on MACD and a reversion in relative strength index (RSI) from oversold levels bring about an attempt for prices to recover. That said, the US$7,700 level will serve as a key test of resistance ahead, where previous dip-buying efforts in early-July failed to sustain with a key 50% Fibonacci retracement in place. Any reversal at current point could mark the formation of a new lower high and potentially bring further downside to the US$6,833 level next.

Tuesday: DJIA -0.71%; S&P 500 -1.15%; Nasdaq -1.87%, DAX -0.86%, FTSE +0.00%
IGA, may distribute information/research produced by its respective foreign affiliates within the IG Group of companies pursuant to an arrangement under Regulation 32C of the Financial Advisers Regulations. Where the research is distributed in Singapore to a person who is not an Accredited Investor, Expert Investor or an Institutional Investor, IGA accepts legal responsibility for the contents of the report to such persons only to the extent required by law. Singapore recipients should contact IGA at 6390 5118 for matters arising from, or in connection with the information distributed.
The information/research herein is prepared by IG Asia Pte Ltd (IGA) and its foreign affiliated companies (collectively known as the IG Group) and is intended for general circulation only. It does not take into account the specific investment objectives, financial situation, or particular needs of any particular person. You should take into account your specific investment objectives, financial situation, and particular needs before making a commitment to trade, including seeking advice from an independent financial adviser regarding the suitability of the investment, under a separate engagement, as you deem fit.
No representation or warranty is given as to the accuracy or completeness of this information. Consequently, any person acting on it does so entirely at their own risk. Please see important Research Disclaimer.
Please also note that the information does not contain a record of our trading prices, or an offer of, or solicitation for, a transaction in any financial instrument. Any views and opinions expressed may be changed without an update.

Seize a share opportunity today
Go long or short on thousands of international stocks.
- Increase your market exposure with leverage
- Get spreads from just 0.1% on major global shares
- Trade CFDs straight into order books with direct market access
Live prices on most popular markets
- Forex
- Shares
- Indices
See more forex live prices
See more shares live prices
Prices above are subject to our website terms and agreements. Prices are indicative only. All shares prices are delayed by at least 15 mins.
See more indices live prices
Prices above are subject to our website terms and agreements. Prices are indicative only. All shares prices are delayed by at least 20 mins.
