Sell in May and go away? Where to next for the S&P 500, Nasdaq 100, FTSE 100 and DAX 40?
Outlook on the S&P 500, Nasdaq 100, FTSE 100 and DAX 40 amid aggressive monetary tightening, recessionary fears and liquidity worries.


Is “sell in May and go away” a good strategy to follow?
With major stock indices such as the US 500, US Tech 100, FTSE 100 and Germany 40 trading close to one-year highs near critical technical resistance, having had another positive month in April, following two consecutive positive quarters – usually a sign of further upside to be seen – the question is whether stock markets may soon enter a consolidation phase in the historically seasonally weaker period of the year between May and October.
It is true that since records began, most significant market corrections or stock market declines occurred during the Western summer months into October but when looking at the past decade, the picture becomes less clear.
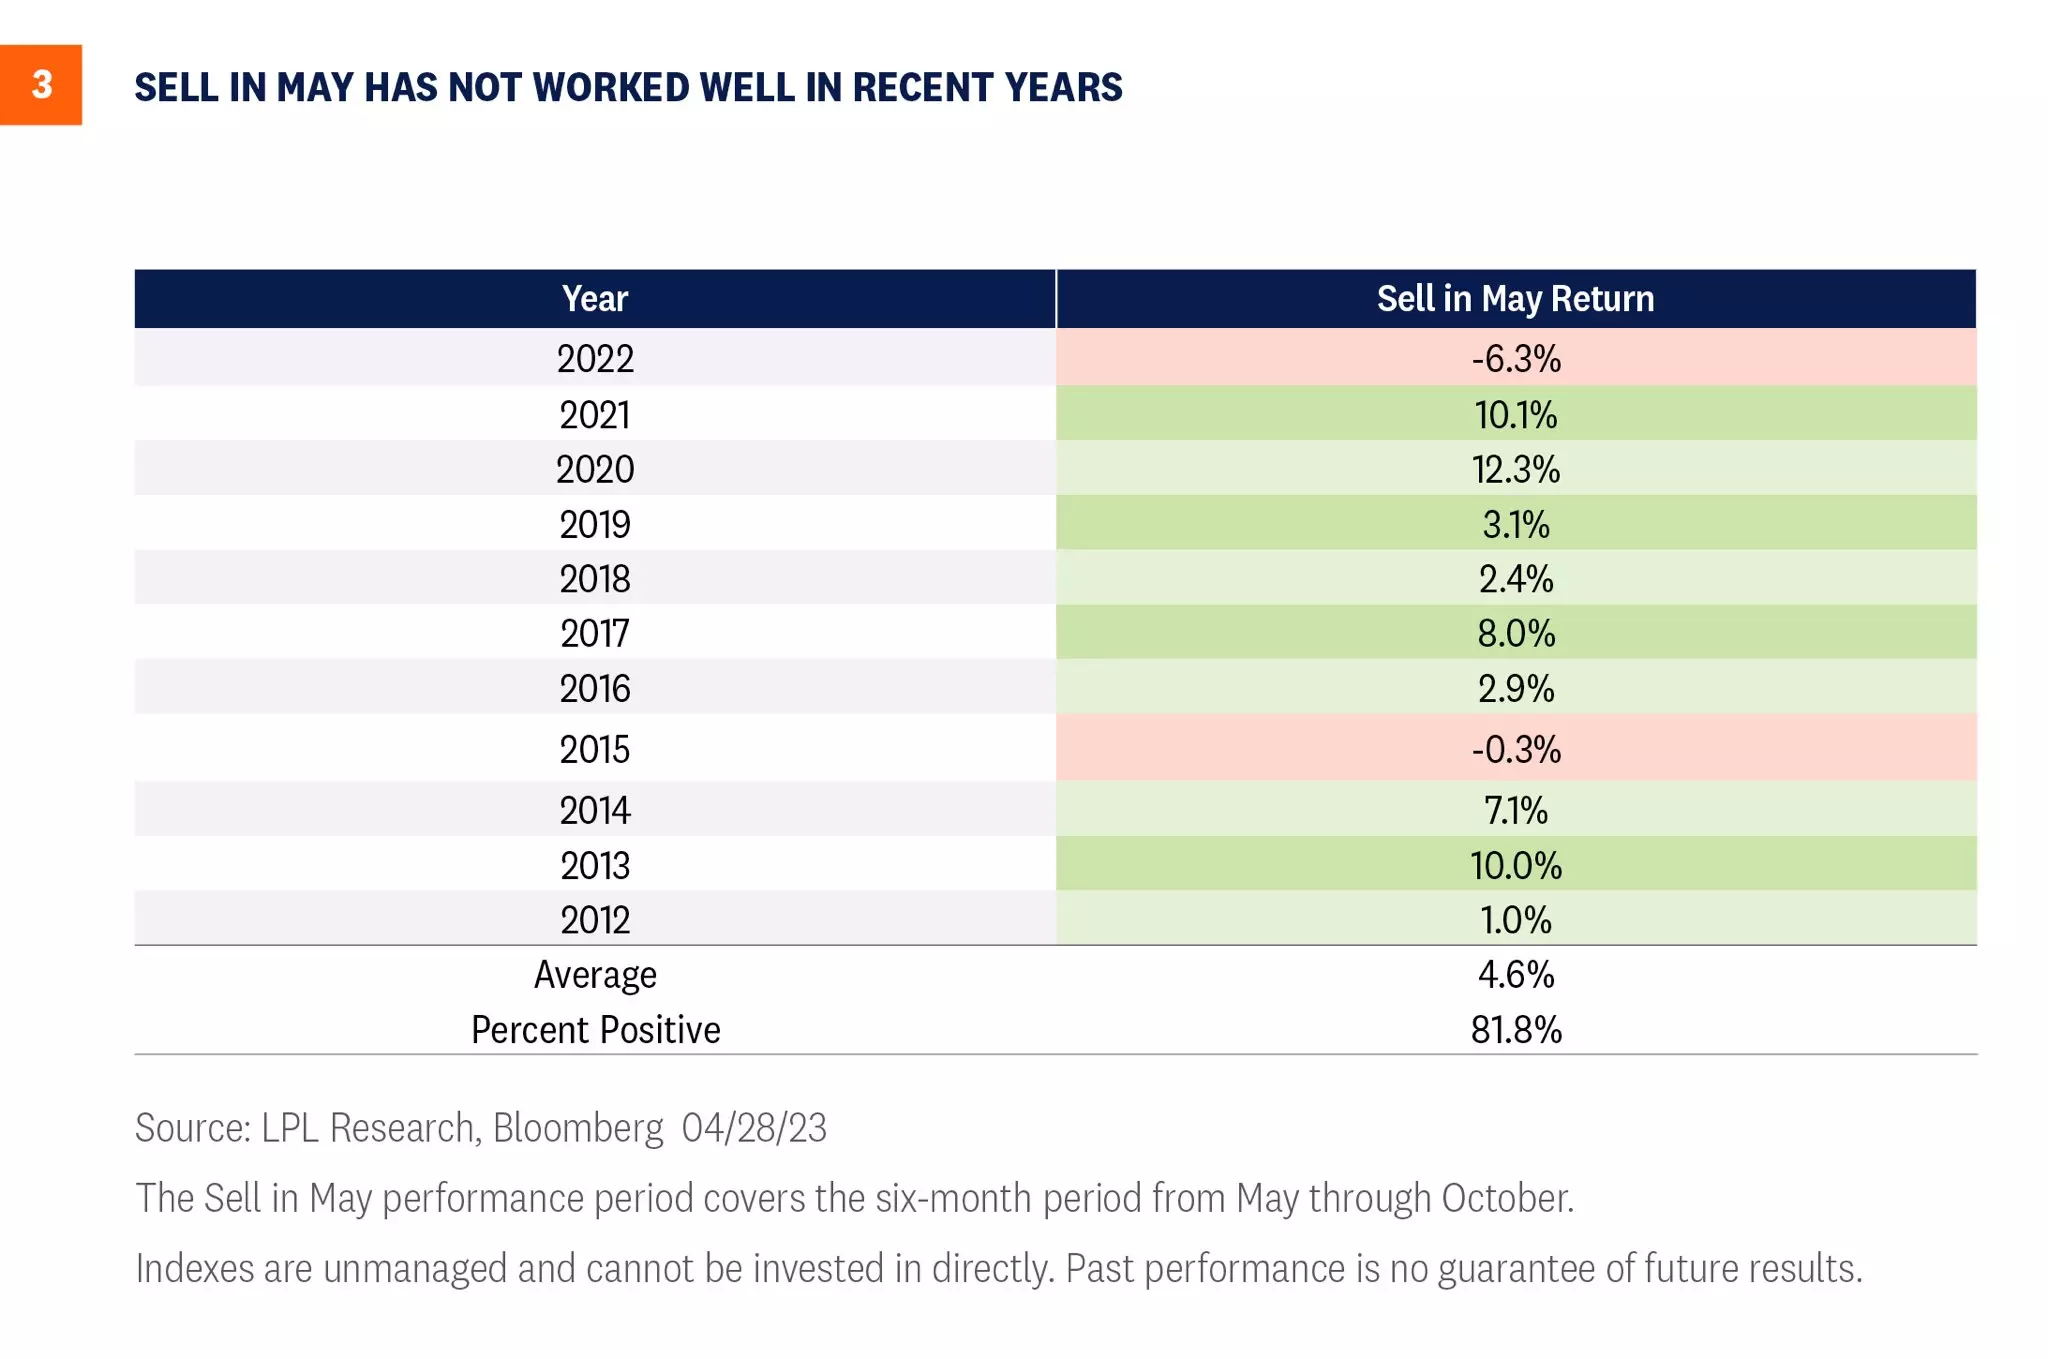
According to LPL Research with Bloomberg data, had one sold unmanaged equity indices at the beginning of May and bought these back at the end of October, one would have lost out on significant profits over the past decade, despite this strategy having worked well in 2022.
Ten year perfomance chart of sell in May strategy
What about liquidity drying up following the banking crisis?
Fundamental investors may worry about liquidity drying up due to the recent banking crisis with three US banks, Silicon Valley Bank, Signature Bank and now First Republic Bank all having failed in just under a couple of months, the latter representing the second-biggest bank failure in the US’ history.
As banks will be forced to comply with tougher rules that are likely to crimp their ability to lend at a time when the US economy is beginning to feel the brunt of the Federal Reserve’s aggressive monetary tightening, the US may be sliding into a recession later this year and do so with a hard landing which would hurt equity indices.
And market breadth?
The lack of market breadth in the gains seen since October of last year may also worry some investors.
Although the S&P 500 has risen by roughly 17% and the Nasdaq’s six biggest stocks by over 45% on an equal-weighted basis since October, mid-caps have gained a more modest 9%, small- caps only 4%, and micro-caps have fallen by 3%.
It is better-than-expected earnings by tech giants such as Microsoft Corp (24 Hours), Meta Platforms Inc and Alphabet Inc - C (24 Hours) last week which have cemented their leadership. The S&P 500’s market capitalisation, which is up 8% this year, has mainly been driven higher by the index’s seven largest stocks which make up 80% of the gains.
Having said that, weak market breadth and a gloomy economic forecast don’t necessarily mean that stock markets cannot continue to perform over the coming months and quarters.
What does technical analysis have to say?
The S&P 500 has come to within a whisker of its 4195.44 February peak at the beginning of May before rapidly giving back some of its recent gains ahead of Wednesday’s Federal Open Market Committee (FOMC) meeting at which another 25 basis-point rate hike is expected to raise the fed funds rate to between 5.00% to 5.25%.
From a short-term technical perspective the March-to-May uptrend will remain intact as long as no fall through and daily chart close below the late April low at 4049.35 is seen. If so, an interim top is likely to have been formed with the 200-day simple moving average (SMA) at 3,967.93 and the October-to-May uptrend line at 3,925.32 being reached.
As long as the next lower December and March lows at 3,808.86 to 3,764.49 underpin on a weekly chart closing basis, the October-to-May medium-term uptrend remains intact.
S&P 500 Daily Chart
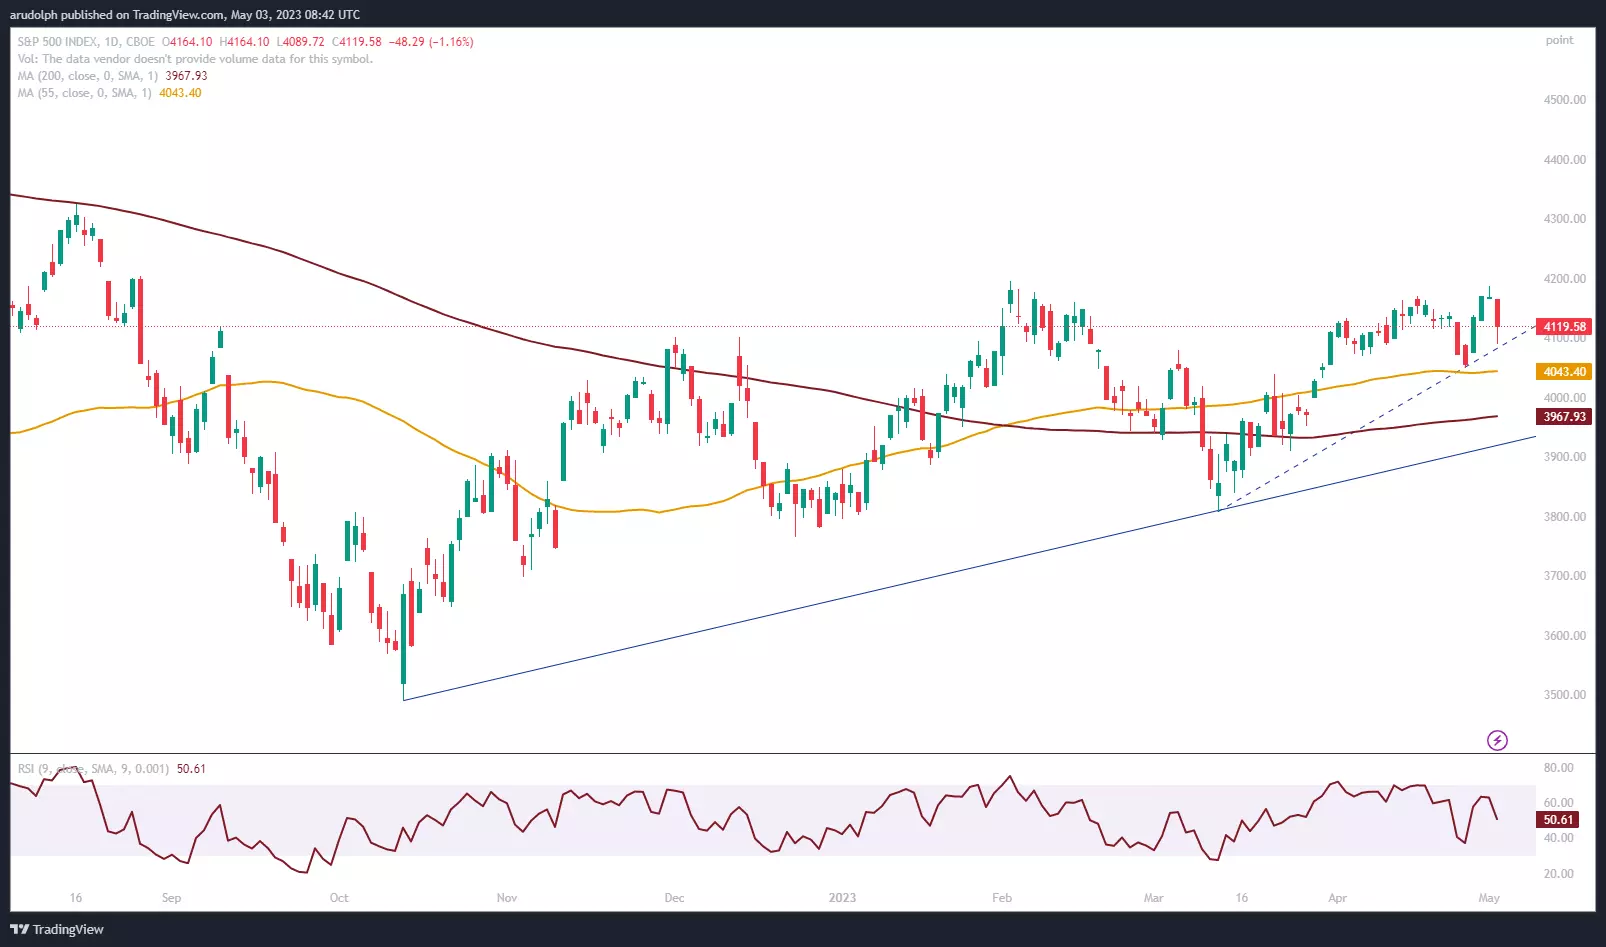
If, however, a continued advance to above the February peak at 4,195.44 were to take place, the way would be open for not only the August 2022 peak at 4,325.28 to be reached, but also the February-to-March 2022 highs at 4,595.31 to 4,637.30.
What about the Nasdaq 100?
The Nasdaq 100, although it briefly managed to break above its eight-month April high at 13,204.08 on the first day of May by rising to 13,287.47, is also displaying negative divergence which may mean that the index may soon fail around current levels before slipping back to its 2023 uptrend line at 12,504.
Nasdaq 100 Daily Chart:
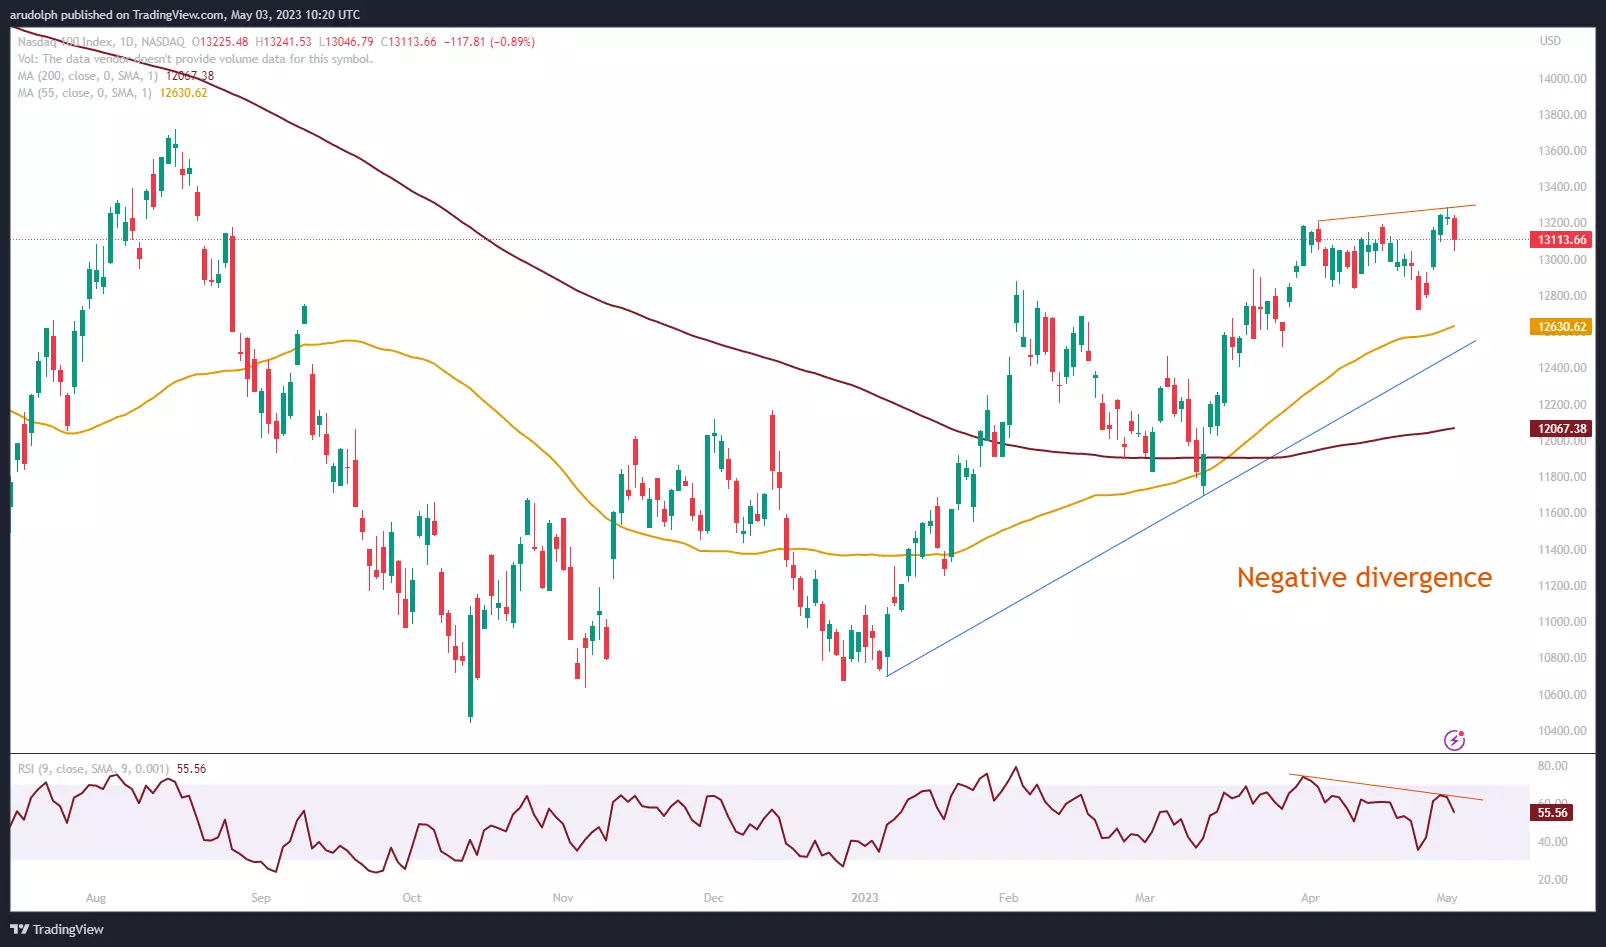
For the bulls to remain in control and for the August peak at 13,720.91 to remain in focus, not only does the Nasdaq 100 need to stay above its last reaction low at the 12,724.24 late March low, but also overcome its current May high at 13,287.47 on a daily chart closing basis.
What about European share indices such as the FTSE 100 and DAX 40?
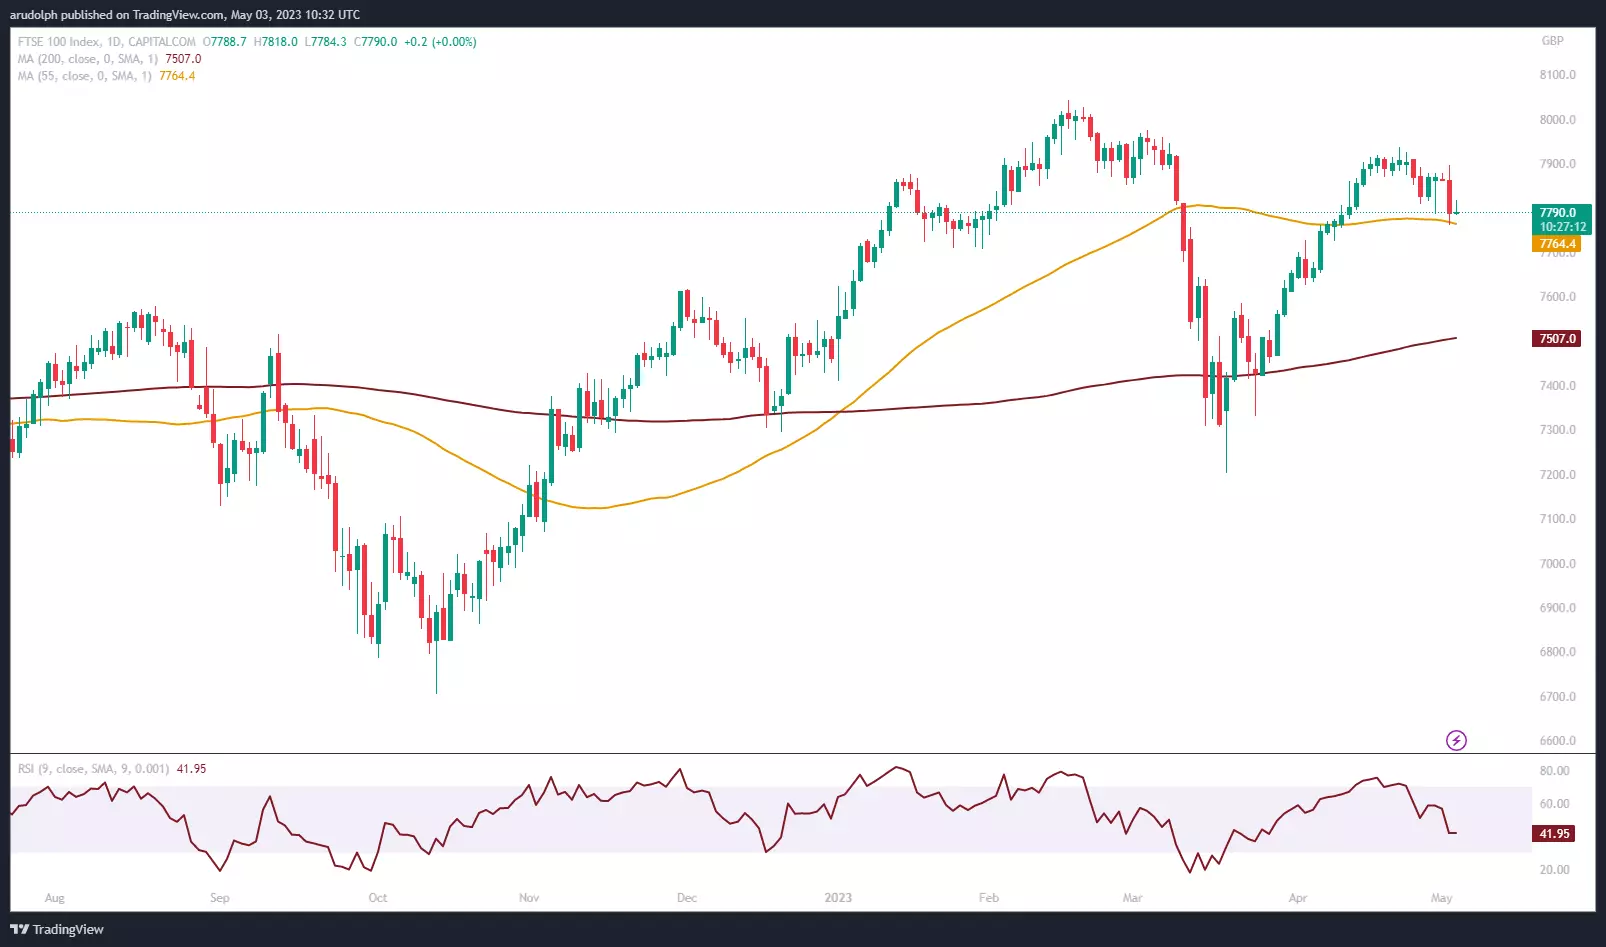
The FTSE 100 is already greatly underperforming its peers year-to-date which can also be seen on its daily chart where the index, unlike several of its US and European counterparts, did not come close to its February high at 8044.40 in April when it only managed to rise as high as 7,938.30 before heading back down again and hugging its 55-day simple moving average (SMA) at 7,764.4 whilst targeting the August and December 2022 highs at 7,616.60 to 7,578.5.
FTSE 100 year-to-date relative performance
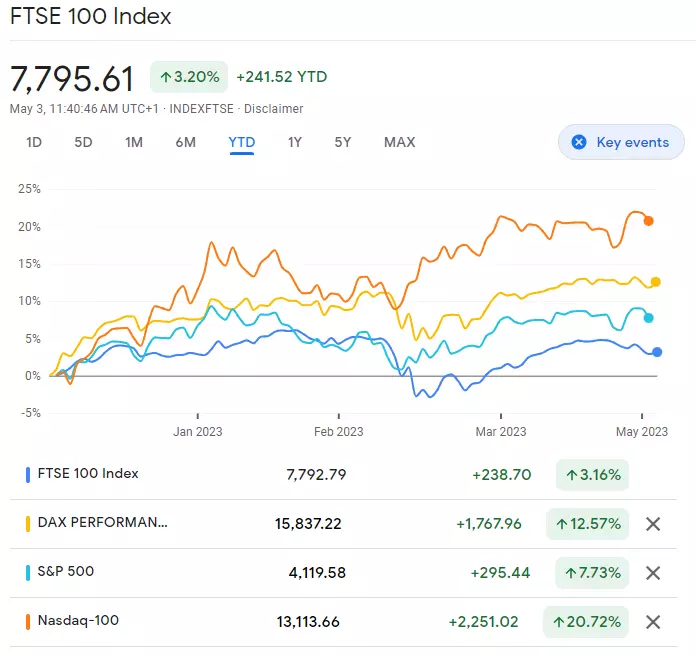
Unless the April high at 7,938.30 is exceeded on a daily chart closing basis, further weakness is likely to be witnessed.
FTSE 100 Daily Chart
The technical picture is quite similar with regards to the DAX 40, even though it is outperforming the FTSE 100 by close to 10% year-to-date in that the German equity index is also displaying negative divergence at a time when it seems to be keeling over and losing upside momentum, all of which points to a slip back towards its October-to-May uptrend line at 15,115 taking shape.
DAX 40 Daily Chart
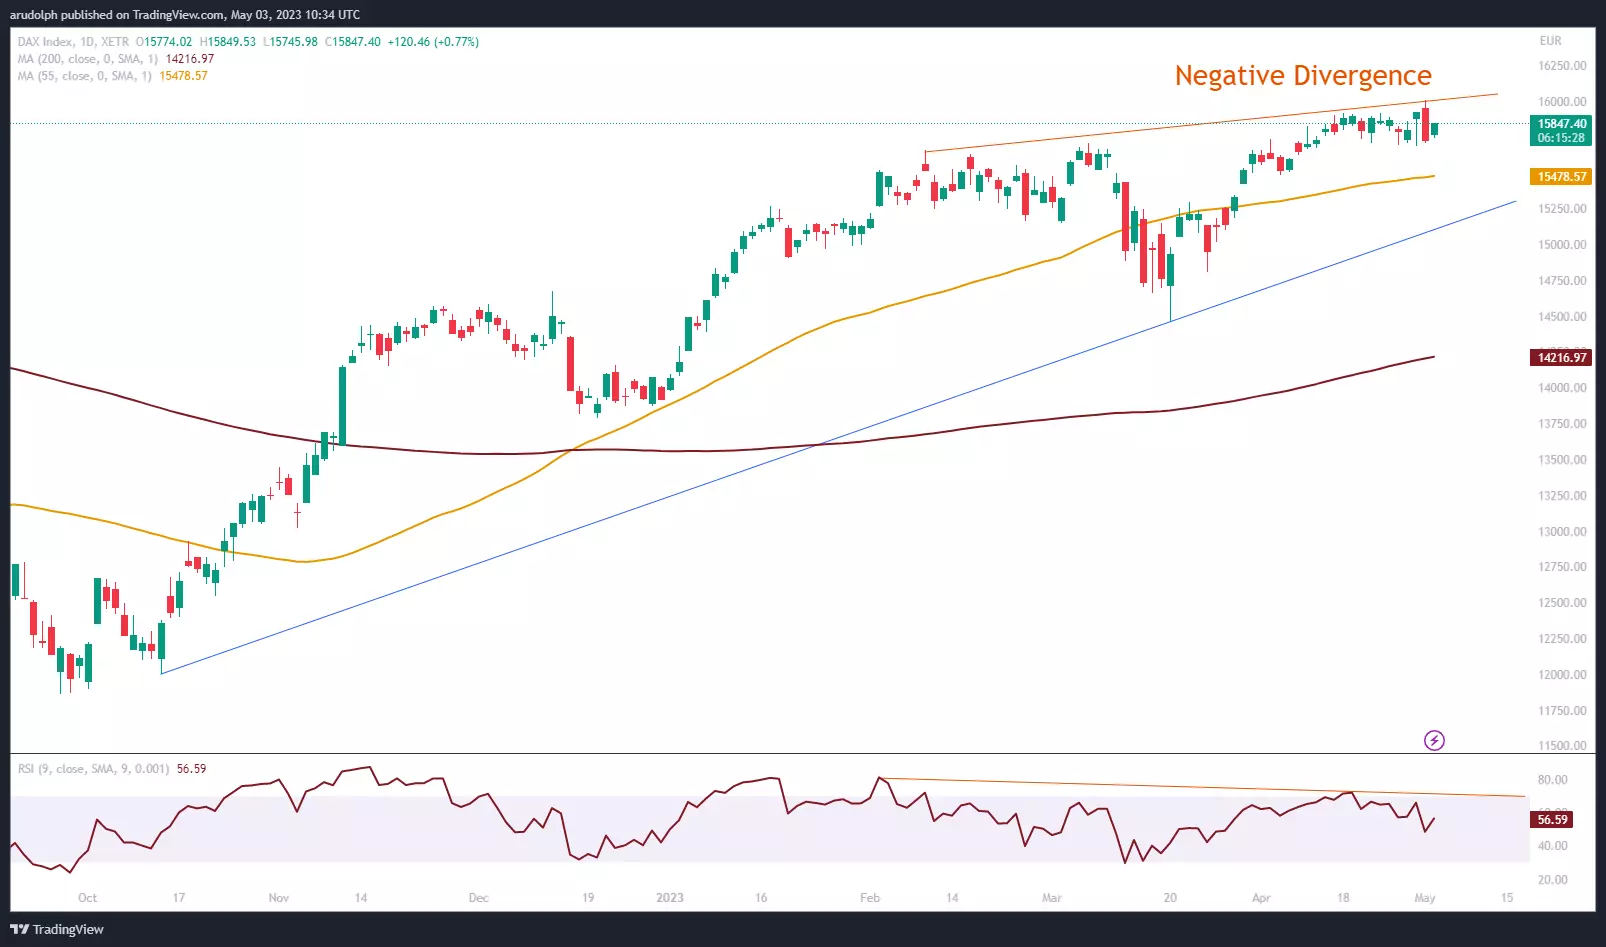
Only a clear rise and weekly chart close above the current May high at 16,011.56 would indicate that further upside remains in store with the November 2021 and January 2022 all-time highs at 16,285.35 to 16,290.19 being back in the picture.
This bullish scenario remains possible while last week’s low at 15,688.17 underpins on a daily chart closing basis.
IGA, may distribute information/research produced by its respective foreign affiliates within the IG Group of companies pursuant to an arrangement under Regulation 32C of the Financial Advisers Regulations. Where the research is distributed in Singapore to a person who is not an Accredited Investor, Expert Investor or an Institutional Investor, IGA accepts legal responsibility for the contents of the report to such persons only to the extent required by law. Singapore recipients should contact IGA at 6390 5118 for matters arising from, or in connection with the information distributed.
The information/research herein is prepared by IG Asia Pte Ltd (IGA) and its foreign affiliated companies (collectively known as the IG Group) and is intended for general circulation only. It does not take into account the specific investment objectives, financial situation, or particular needs of any particular person. You should take into account your specific investment objectives, financial situation, and particular needs before making a commitment to trade, including seeking advice from an independent financial adviser regarding the suitability of the investment, under a separate engagement, as you deem fit.
No representation or warranty is given as to the accuracy or completeness of this information. Consequently, any person acting on it does so entirely at their own risk. Please see important Research Disclaimer.
Please also note that the information does not contain a record of our trading prices, or an offer of, or solicitation for, a transaction in any financial instrument. Any views and opinions expressed may be changed without an update.

Take a position on indices
Deal on the world’s major stock indices today.
- Trade the lowest Wall Street spreads on the market
- 1-point spread on the FTSE 100 and Germany 40
- The only provider to offer 24-hour pricing
Live prices on most popular markets
- Forex
- Shares
- Indices
See more forex live prices
See more shares live prices
Prices above are subject to our website terms and agreements. Prices are indicative only. All shares prices are delayed by at least 15 mins.
See more indices live prices
Prices above are subject to our website terms and agreements. Prices are indicative only. All shares prices are delayed by at least 20 mins.
