S&P 500 Momentum Report
With rate-cut views validated by US policymakers at the recent FOMC meeting, the risk rally has found further momentum towards year-end, as the S&P 500 logged its seventh straight week of consecutive gains.


S&P 500 logged its seventh straight week of gains, with eyes on its all-time high ahead
With rate-cut views validated by US policymakers at the recent Federal Open Market Committee (FOMC) meeting, the risk rally has found further momentum towards year-end, as the S&P 500 logged its seventh straight week of consecutive gains. We may have to go back all the way to 2017 to see a seven-week winning streak from the index.
From the macro lens, the trend of easing US inflation and soft landing hopes have kept risk-on sentiments well-anchored, with earlier pushback on rate cuts by Federal Reserve (Fed) members failing to trigger much of a dent. As we head into year-end, with both the Dow Jones Industrial Average (DJIA) and Nasdaq touching its all-time high, all eyes will be on whether the S&P 500 can deliver as well, standing just less than 1.5% away.
For now, extreme overbought technical conditions do reveal considerable risks in opening fresh longs at current level, with the relative strength index (RSI) on the daily chart hovering at its highest level since September 2020. The 4,740 level may stand as immediate resistance to overcome for the index, serving as a strong hurdle on previous three occasions. Having broken out of a falling channel pattern back in mid-November this year, the 4,740 level also marked the eventual price projection of the channel breakout. That said, the broader upward trend remains intact with the series of higher highs and higher lows in place since October 2022, with any retracement likely to be a temporary move.
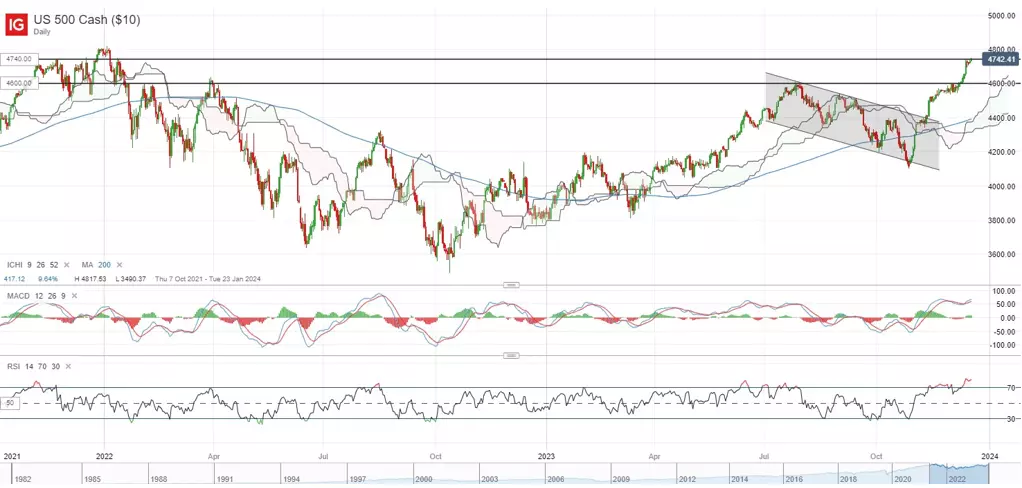
Source: IG charts
In terms of market breadth, the percentage of S&P 500 stocks above their 50-day moving averages (MA) are currently hovering at extreme overbought levels (88% versus previous peaks of 90-92%). Similarly, the percentage of S&P 500 stocks above their 100-day MA are also touching previous peaks of around 80-82%, which may suggest that the risk-reward may be less ideal at current stage. The Fear & Greed Index are also back to ‘extreme greed’ levels for the first time since August 2023, while the VIX has somewhat stabilised at current levels over the past few trading days.
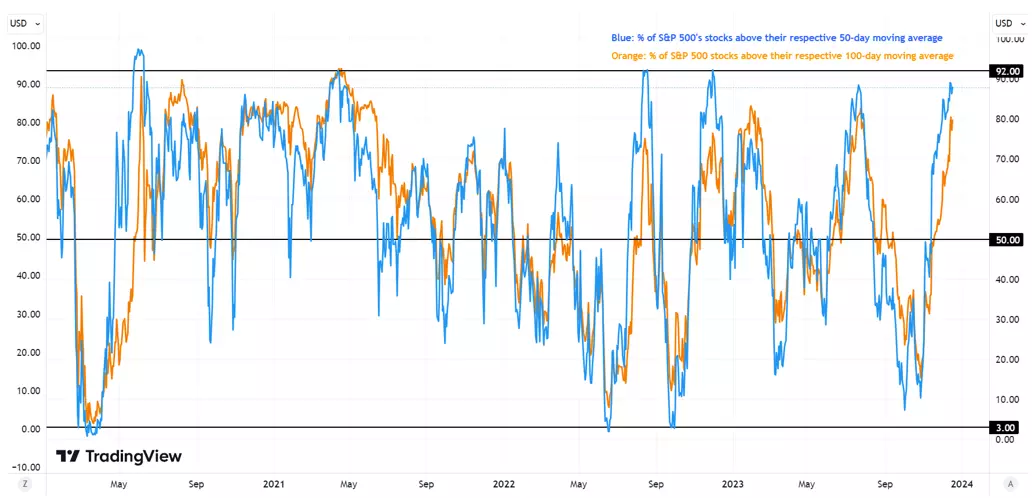
Source: TradingView
Ahead this week, we will have the last piece of US inflation data for the year – the US core Personal Consumption Expenditure (PCE) price data, which will be closely watched for validation that the US disinflation trend is continuing. In contrast to the Fed's projection of three rate cuts next year, the interest rate market still expects six rate cuts in 2024, with the first cut as early as March 2024. Therefore, a quicker moderation in inflation back to the 2% target will be much-needed to confirm such dovish expectations.
The consensus expectation is for November core PCE to ease to 3.3% from previous 3.5%, which will be the lowest rate since May 2021. Likewise, the headline PCE is expected to moderate to 2.8% from previous 3.0%.
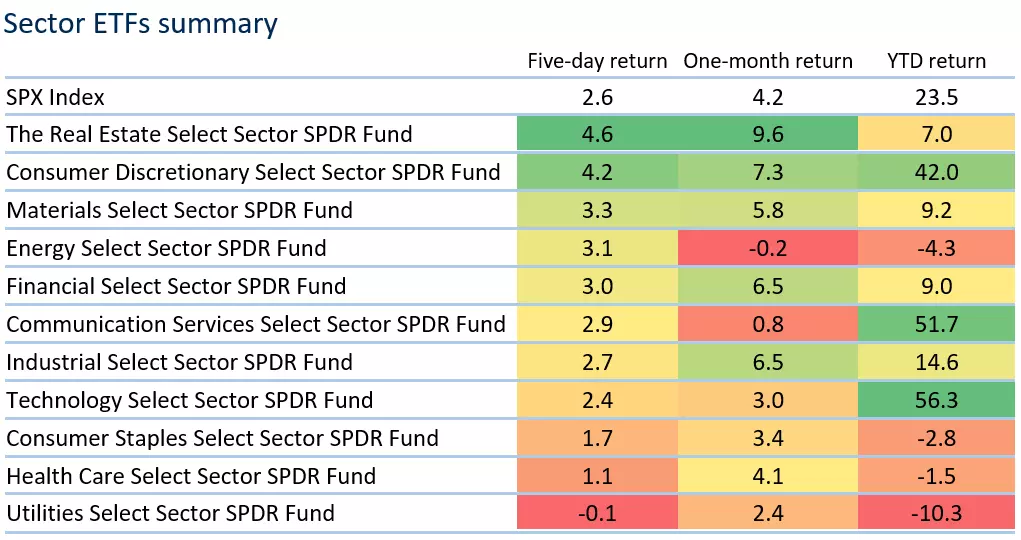
Sector performance
In terms of sector performance last week, market participants clearly leaned towards taking on higher risks post-FOMC as defensive sectors (consumer staples, healthcare, utilities) underperformed. Nevertheless, risk-on sentiments remain broad-based, with ten out of 11 S&P 500 sectors in the green last week, aiding the S&P 500 to deliver its seventh week of gains. The ‘Magnificent Seven’ stocks were all higher for the week, but with more notable performance coming from Nvidia (+7.4%), Meta Platforms (+6.0%),Amazon (+5.6%) and Tesla (+5.2%). The rate-sensitive real estate sector was the top performing sector, continuing its catch-up traction on the Fed’s dovish rhetoric. The sector has been the top performer over the past month as well. On the other hand, the energy sector managed to pull off some gains as oil prices recover from its lowest level since July 2023, but the bulk of 2023 has largely seen the sector consolidate in a range. Year-to-date, the sector remained in the red (-4.3%), alongside the defensive sectors.
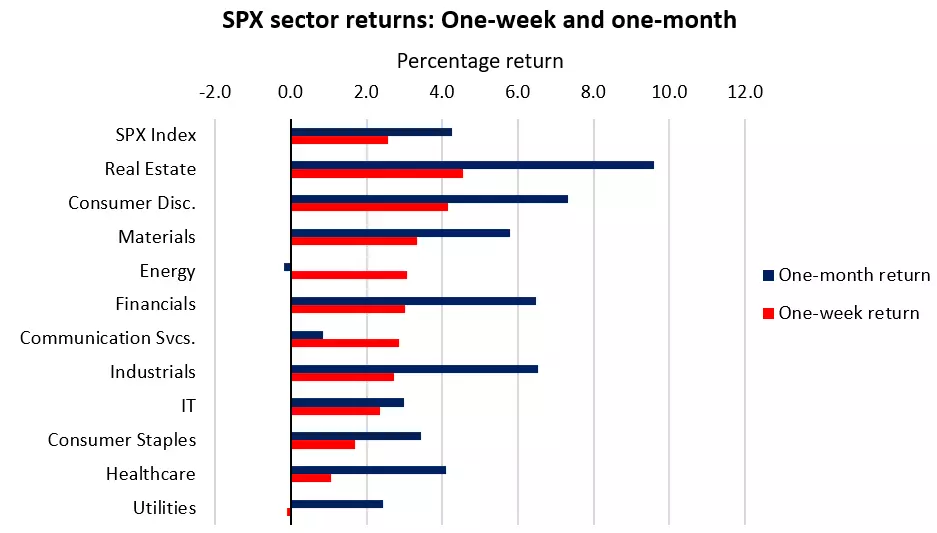
Source: Refinitiv
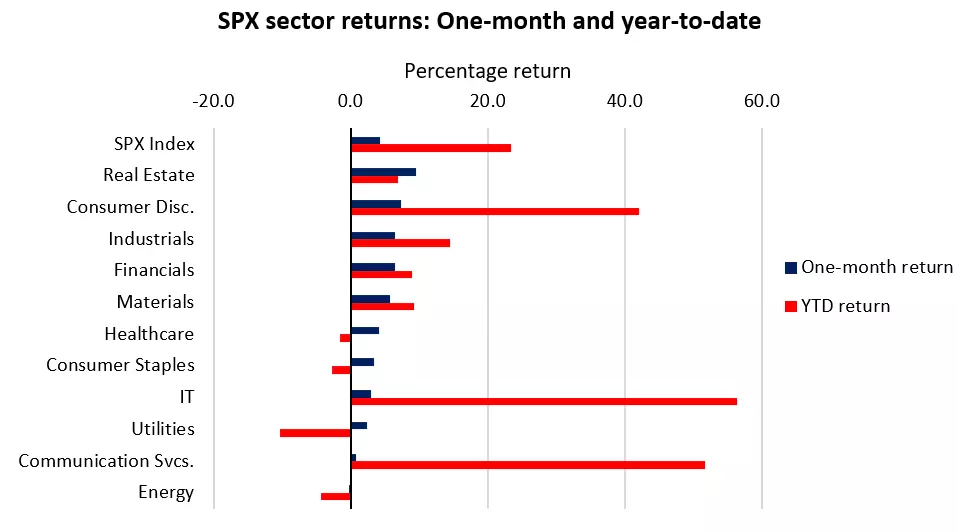
Source: Refinitiv
Source: Refinitiv
*Note: The data is from 12th – 18th December 2023.
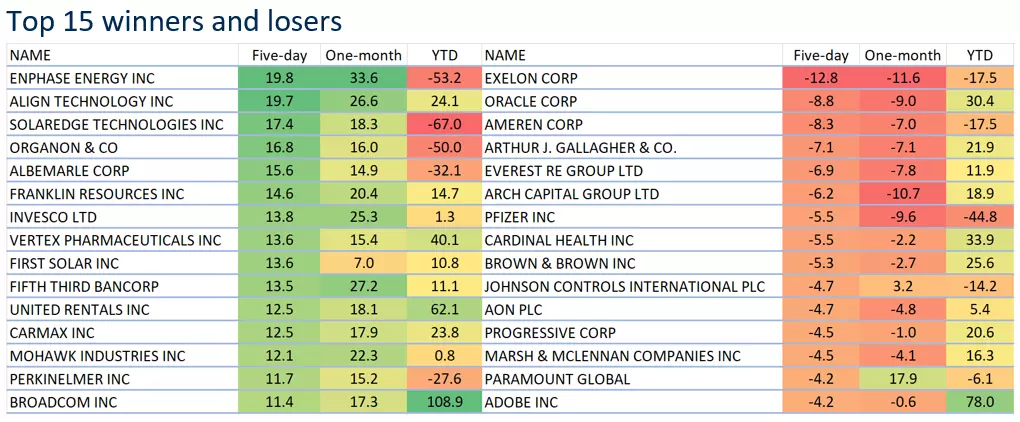
Source: Refinitiv
*Note: The data is from 12th – 18th December 2023.
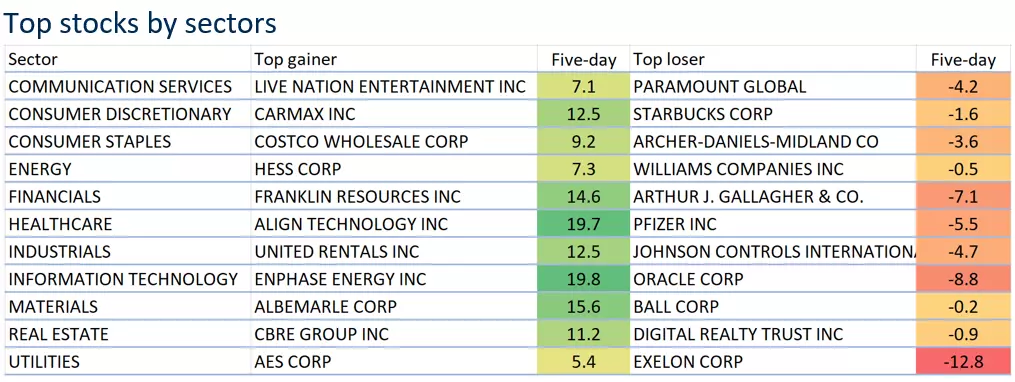
Source: Refinitiv
*Note: The data is from 12th – 18th December 2023.
IGA, may distribute information/research produced by its respective foreign affiliates within the IG Group of companies pursuant to an arrangement under Regulation 32C of the Financial Advisers Regulations. Where the research is distributed in Singapore to a person who is not an Accredited Investor, Expert Investor or an Institutional Investor, IGA accepts legal responsibility for the contents of the report to such persons only to the extent required by law. Singapore recipients should contact IGA at 6390 5118 for matters arising from, or in connection with the information distributed.
The information/research herein is prepared by IG Asia Pte Ltd (IGA) and its foreign affiliated companies (collectively known as the IG Group) and is intended for general circulation only. It does not take into account the specific investment objectives, financial situation, or particular needs of any particular person. You should take into account your specific investment objectives, financial situation, and particular needs before making a commitment to trade, including seeking advice from an independent financial adviser regarding the suitability of the investment, under a separate engagement, as you deem fit.
No representation or warranty is given as to the accuracy or completeness of this information. Consequently, any person acting on it does so entirely at their own risk. Please see important Research Disclaimer.
Please also note that the information does not contain a record of our trading prices, or an offer of, or solicitation for, a transaction in any financial instrument. Any views and opinions expressed may be changed without an update.

Seize a share opportunity today
Go long or short on thousands of international stocks.
- Increase your market exposure with leverage
- Get spreads from just 0.1% on major global shares
- Trade CFDs straight into order books with direct market access
Live prices on most popular markets
- Forex
- Shares
- Indices
See more forex live prices
See more shares live prices
Prices above are subject to our website terms and agreements. Prices are indicative only. All shares prices are delayed by at least 15 mins.
See more indices live prices
Prices above are subject to our website terms and agreements. Prices are indicative only. All shares prices are delayed by at least 20 mins.
