S&P 500 and NASDAQ technical outlook: bullish view intact after the Fed
US equities’ technical posture continues to improve; the S&P 500 and the Nasdaq 100 index look set to rise toward their respective August highs and what are the key levels to watch?
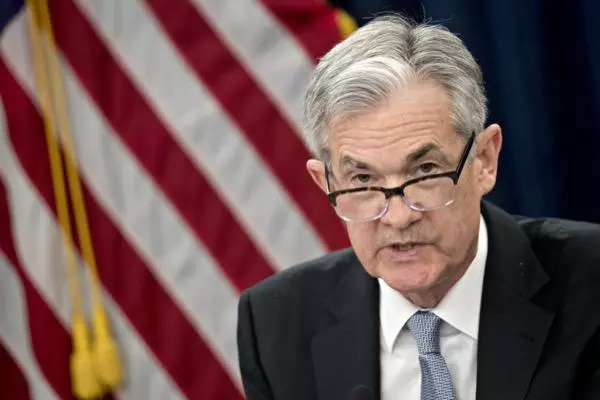

The Fed hiked interest rates by 25 basis points to 4.5% - 4.75%, in line with expectations, and said “ongoing increases” to rates would be appropriate. However, the US central bank acknowledged that inflation has eased.
“We can now say for the first time that the disinflationary process has started,” Fed Chair Jerome Powell told reporters, boosting hopes that the Fed is nearing the end of the current rate hiking cycle. The futures market continues to price in rate cuts this year with the fed funds rate seen below 4.50% by the end of December.
S&P 500 technical outlook – bullish
The S&P 500 closed on Thursday above crucial resistance at the early-December high of 4100, reasserting the bullish bias. This follows a rise above another vital barrier on the 200-day moving average and a rebound from quite a strong cushion around the Ichimoku cloud support on the daily chart.
While the upward momentum has improved recently, one closer above Wednesday’s high would cement the view that the index had formed an important base. Moreover, the European Central Bank and the Bank of England interest rate decisions today and US jobs data on Friday could provide further cues.
A decisive close (two daily closing highs) would establish the higher-highs-higher-lows sequence for the first time since January 2022. Such a break could pave the way toward the August high of 4325.
S&P 500 daily chart

NASDAQ technical outlook – bullish
The Nasdaq 100 index, which wrapped the best January performance in 20 years, on Thursday rose above stiff converged hurdle, including the December high of 12166 and the 200-day moving average. This is the first time the index has risen above the multi-week average since January 2022, raising the prospect of a more sustained bounce relative to the corrective rallies in 2022.
However, given the events risks and key US data due tomorrow, it might be prudent to wait for one more close higher. Such a move would raise the odds of a rise toward the August high of 13720 as it would trigger a bullish break from the sideways channel since the end of 2022. Furthermore, if the Nasdaq 100 index manages to close this week above 12166 then it would also imply that the base around the 200-week moving average had been set.
NASDAQ 100 daily chart

Take your position on over 13,000 local and international shares via CFDs or share trading – and trade it all seamlessly from the one account. Learn more about share CFDs or shares trading with us, or open an account to get started today.
IGA, may distribute information/research produced by its respective foreign affiliates within the IG Group of companies pursuant to an arrangement under Regulation 32C of the Financial Advisers Regulations. Where the research is distributed in Singapore to a person who is not an Accredited Investor, Expert Investor or an Institutional Investor, IGA accepts legal responsibility for the contents of the report to such persons only to the extent required by law. Singapore recipients should contact IGA at 6390 5118 for matters arising from, or in connection with the information distributed.
The information/research herein is prepared by IG Asia Pte Ltd (IGA) and its foreign affiliated companies (collectively known as the IG Group) and is intended for general circulation only. It does not take into account the specific investment objectives, financial situation, or particular needs of any particular person. You should take into account your specific investment objectives, financial situation, and particular needs before making a commitment to trade, including seeking advice from an independent financial adviser regarding the suitability of the investment, under a separate engagement, as you deem fit.
No representation or warranty is given as to the accuracy or completeness of this information. Consequently, any person acting on it does so entirely at their own risk. Please see important Research Disclaimer.
Please also note that the information does not contain a record of our trading prices, or an offer of, or solicitation for, a transaction in any financial instrument. Any views and opinions expressed may be changed without an update.

Start trading forex today
Trade the largest and most volatile financial market in the world.
- Spreads start at just 0.6 points on EUR/USD
- Analyse market movements with our essential selection of charts
- Speculate from a range of platforms, including on mobile
Live prices on most popular markets
- Forex
- Shares
- Indices
See more forex live prices
See more shares live prices
Prices above are subject to our website terms and agreements. Prices are indicative only. All shares prices are delayed by at least 15 mins.
See more indices live prices
Prices above are subject to our website terms and agreements. Prices are indicative only. All shares prices are delayed by at least 20 mins.
