Nvidia’s share price and Q2 earnings results preview
Outlook on the Nvidia share price ahead of its upcoming Q2 results.

When are Nvidia’s results expected?
Nvidia is set to release its second quarter (Q2) 2023 results on 23 August 2023. The results are for the quarter ending July 2023.
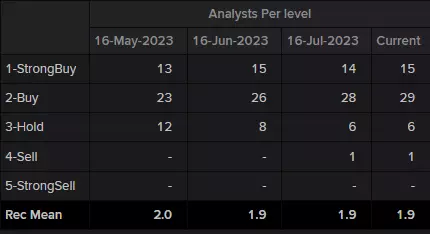
What is ‘The Street’s’ expectation for the Q2 results?
‘The Street’ expectations for the upcoming results are as follows:
Revenue of $11.160 billion : +66.47% year-on-year (YoY)
Earnings per Share (EPS) : $2.07: +405.88% (YoY)
Nvidia – the great outperformer
The ongoing global surge in the demand for Artificial Intelligence (AI) chips continues to squeeze the supply of these with gulf states such as Saudi Arabia and the United Arab Emirates (UAE) entering the fray and buying up thousands of high-performing Nvidia chips.
According to the Financial Times (FT), “Saudi Arabia has bought at least 3,000 of Nvidia’s H100 chips — a $40,000 processor described by Nvidia chief Jensen Huang as “the world’s first computer [chip] designed for generative AI.”
The FT furthermore reported that “the UAE has also secured access to thousands of Nvidia chips and has already developed its own open-source large language model, known as Falcon.”
According to the newspaper, Nvidia is expected to sell over half a million of its high-end H100 computer graphic processing units (GPUs), raking in tens of billions of dollars in 2023.
The period from October 2022 onwards saw increased recession fears and worries about declines in earnings, neither of which has yet occurred on a wider scale.
With so much negative news baked into the share price, there was plenty of room for Nvidia to outperform forecasts, which it duly has. The question for investors now is whether the company’s exceptional gains can be sustained and whether Nvidia can live up to the undeniable hype surrounding AI.
Since AI chip shipments are forecast to increase next year and beyond, Nvidia with a significant market share of around 60%, is expected to benefit massively. With gaming revenue picking up as well, another valuable revenue stream for the company could be further exploited.
But just as Nvidia benefited from the lack of good news last year, this year it continues to face an uphill struggle, even if its share price has so far more than doubled.
Investors remain positive with regards to the company’s coming quarters, but at today’s multiples Nvidia trades at 228 times current earnings. That is an awful lot of good news in the share price, and it seems reasonable to expect that the gravy train will at some stage come to a halt. The question is when exactly this will be.
How to trade Nvidia into the results
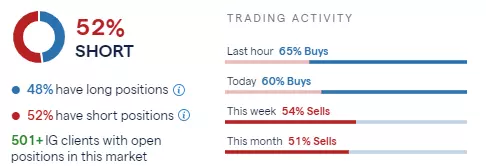
IG sentiment data shows that 52% of clients with open positions on the share (as of 16 August 2023) expect the price to fall over the near term, while 48% of clients expect the price to rise. Trading activity over this week and month shows 54% and 51% of sells, respectively.
Nvidia – technical view
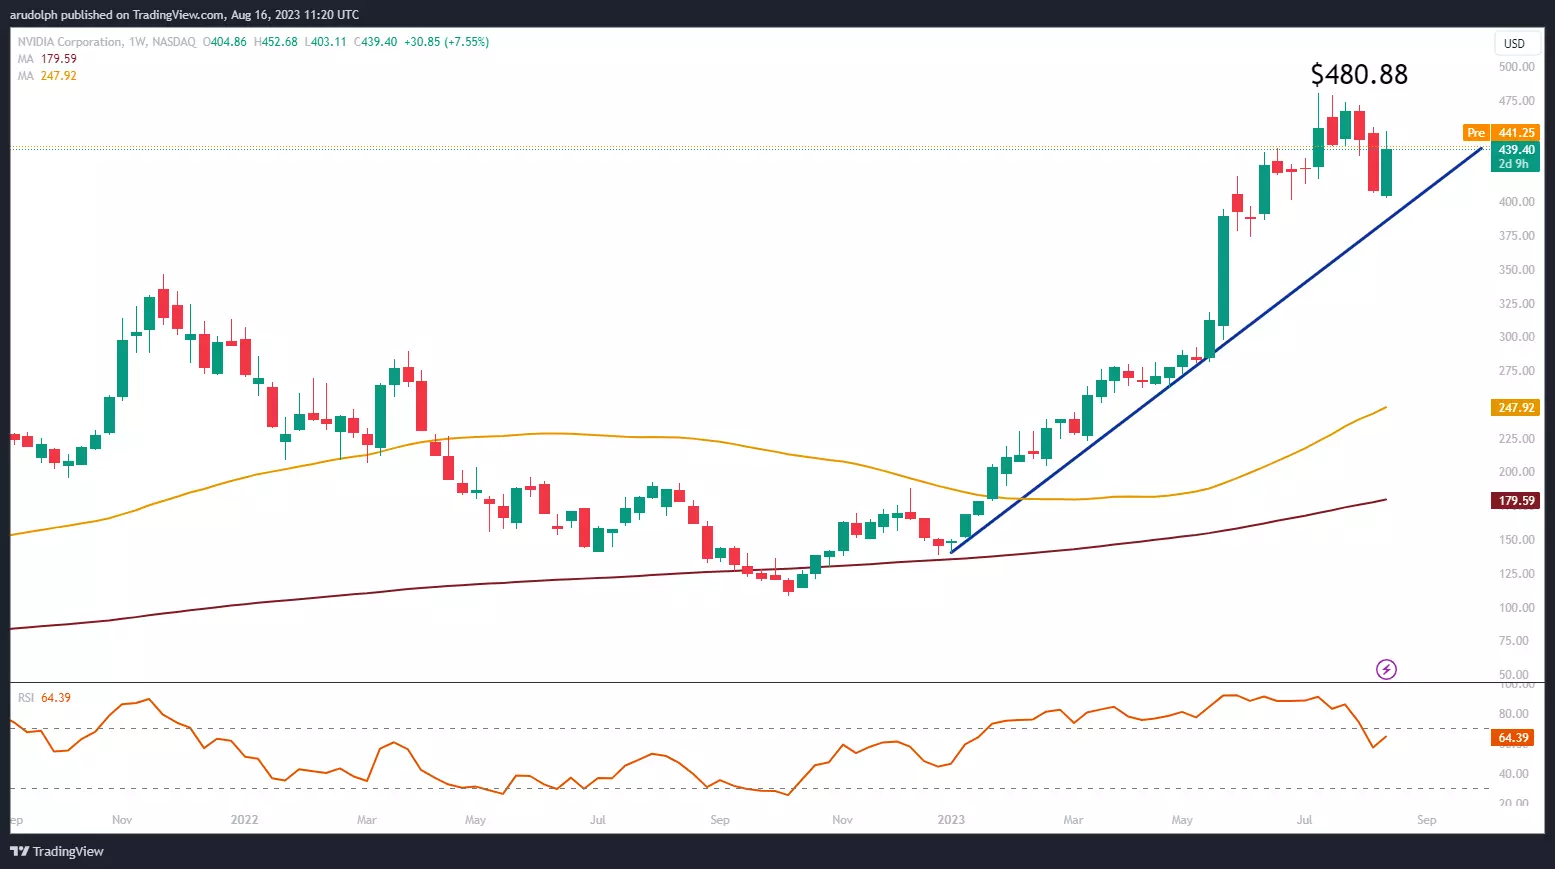
The Nvidia share price has risen by an impressive 207% year-to-date, but has given back around 16% from its mid-July $480.88 all-time high before recouping half of these losses in the course of this week.
According to the 9-Day Relative Strength Index (RSI), the share price is currently bouncing off its oversold level of around 27%. The last time it did so was in January, at the beginning of this year’s impressive bull run.
Nvidia Daily Chart
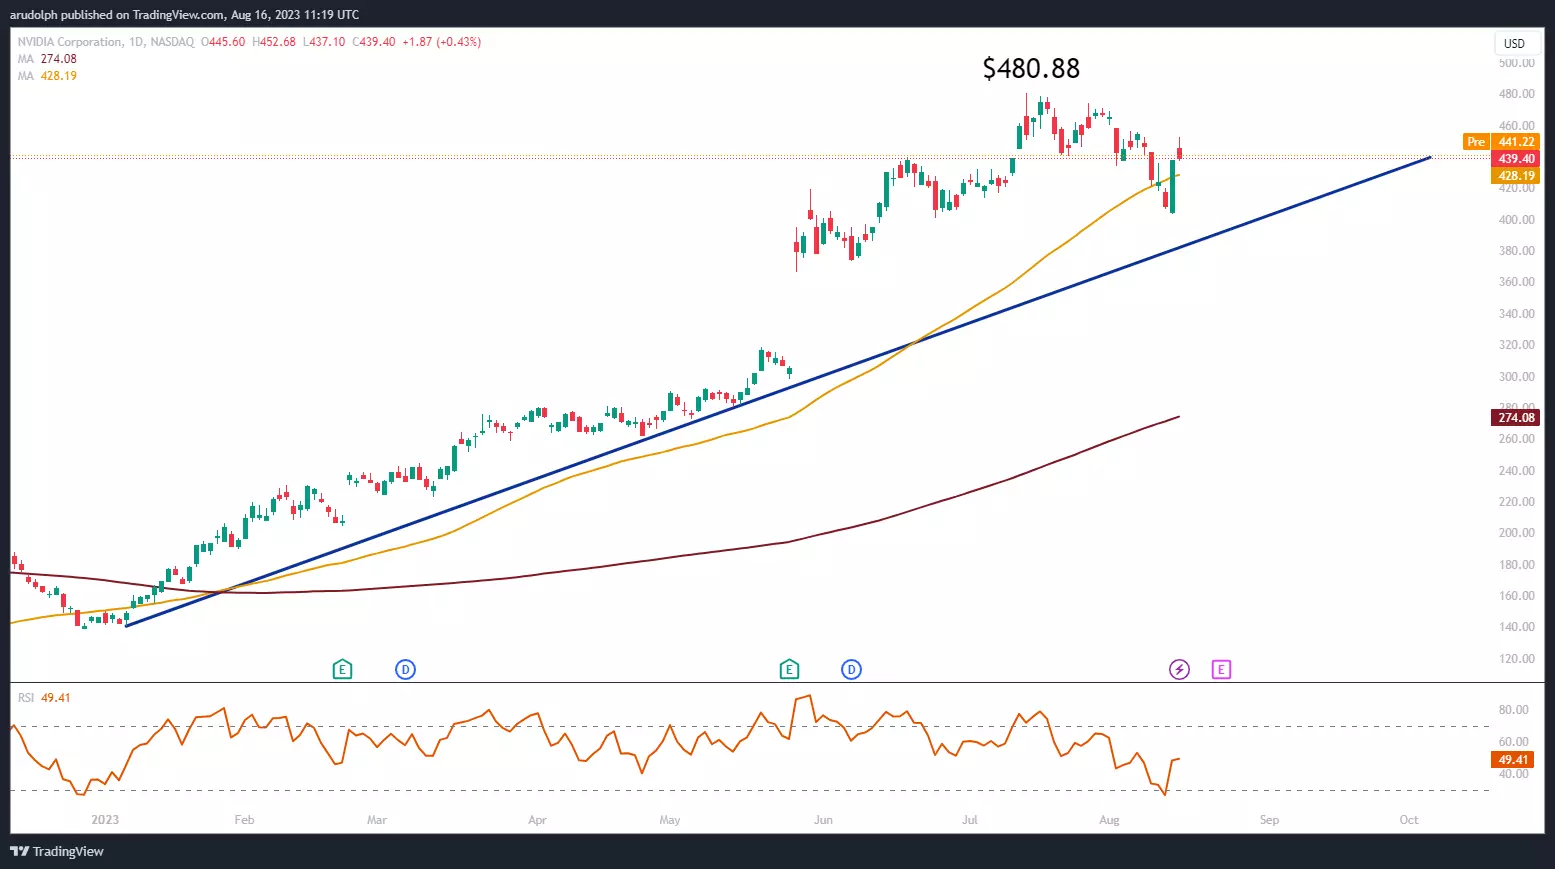
It looks as if the Nvidia share price has ended its recent consolidation phase and has resumed its ascent towards the $500 region.
Only a fall through and daily chart close below not only this year’s uptrend line at $383.90 but also the post Q1 earning’s results low at $366.35, would question our medium-term bullish outlook.
In this scenario the Nvidia share price is expected to at least partially fill the May price gap. The area between the November 2021 high and the mid-May high at $346.47 to $318.28 would then represent a great long-term buying opportunity.
Nvidia Weekly Chart
IGA, may distribute information/research produced by its respective foreign affiliates within the IG Group of companies pursuant to an arrangement under Regulation 32C of the Financial Advisers Regulations. Where the research is distributed in Singapore to a person who is not an Accredited Investor, Expert Investor or an Institutional Investor, IGA accepts legal responsibility for the contents of the report to such persons only to the extent required by law. Singapore recipients should contact IGA at 6390 5118 for matters arising from, or in connection with the information distributed.
The information/research herein is prepared by IG Asia Pte Ltd (IGA) and its foreign affiliated companies (collectively known as the IG Group) and is intended for general circulation only. It does not take into account the specific investment objectives, financial situation, or particular needs of any particular person. You should take into account your specific investment objectives, financial situation, and particular needs before making a commitment to trade, including seeking advice from an independent financial adviser regarding the suitability of the investment, under a separate engagement, as you deem fit.
No representation or warranty is given as to the accuracy or completeness of this information. Consequently, any person acting on it does so entirely at their own risk. Please see important Research Disclaimer.
Please also note that the information does not contain a record of our trading prices, or an offer of, or solicitation for, a transaction in any financial instrument. Any views and opinions expressed may be changed without an update.

Seize a share opportunity today
Go long or short on thousands of international stocks.
- Increase your market exposure with leverage
- Get spreads from just 0.1% on major global shares
- Trade CFDs straight into order books with direct market access
Live prices on most popular markets
- Forex
- Shares
- Indices
See more forex live prices
See more shares live prices
Prices above are subject to our website terms and agreements. Prices are indicative only. All shares prices are delayed by at least 15 mins.
See more indices live prices
Prices above are subject to our website terms and agreements. Prices are indicative only. All shares prices are delayed by at least 20 mins.
