Nvidia share price: Q2 earnings preview
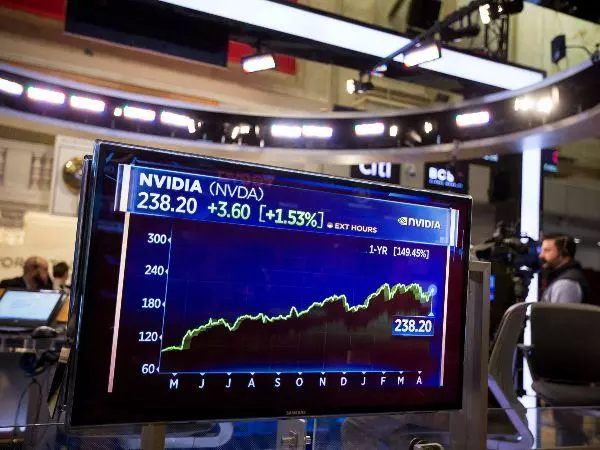
Nvidia’s share price has surged by close to 50% year-to-date. Can its upcoming Q2 results draw further upside for its share price?

When does Nvidia report earnings?
Nvidia is set to release its Q2 financial results on 18 August, after market close.
Nvidia earnings – What to expect
Expectations for its upcoming Q2 results are for revenue to come in at US$6.4 billion, up 64% from a year earlier and up 11.2% from the previous quarter. On the other hand, its earnings per share (EPS) is expected to come in at US$1.02, up 31% from the previous quarter of US$0.78.
A majority 85% of Nvidia’s end-user revenue comes from both its gaming and data centre segment, which has been seeing continued strength over the past four quarters. In light of digital transformation for businesses, the ongoing shift towards cloud is expected to continue to drive demand for its data centre GPUs. The trend has been largely reflected in recent quarter’s results from Microsoft and Amazon, which saw a 51% and 37% year-on-year increase for their cloud segments. On the other hand, the launch of its GeForce RTX 30 Series may continue to provide a tailwind for its gaming segment towards the rest of the year, as the upgrade cycle for its GPU installed base kicks into high gear.

Previous guidance for the timeline of its ARM acquisition is expected to be in early 2022. However, there seems to be more uncertainty in the deal passing through, with the UK recently having concerns about the takeover due to potential risks to national security. The deal will be widely accretive for Nvidia, with potential control of ARM’s IP licensing portfolio giving it an advantage in pricing power, along with internal cost-savings. Any positive surprise on the acquisition progress may be a catalyst to boost share price ahead.
How to trade Nvidia earnings
Nvidia’s forward P/E currently stands at 47.2, commanding a significant premium over the technology sector of 17.5. This may come as Nvidia continues to dominate the discrete graphics processing unit (GPU) space with a 81% market share as of Q1 2021. With its revenue growth rate over the past three years largely pulling ahead of its peers, high expectations for its growth rate to continue may also be priced into its valuation.

Currently, the stock has 37 ‘buy’ recommendations, six ‘holds’ and two ‘sells’. The last closing price of US$196.99 at the time of writing seems to be in line with the Bloomberg 12-month consensus target price of US$198.07.
Nvidia shares – technical analysis
Nvidia’s share price seems to form a double top formation, with key resistance at its recent all-time high around the US$207.50 level. Near-term support may potentially be at the US$192.50 level, where an upward sloping trendline connecting higher lows since March may come into play. This will be followed by the US$177.50 level, where the neckline of the double top formation will be closely watched. A potential break below the neckline may point to further downside in share price towards its 200-day moving average.

IGA, may distribute information/research produced by its respective foreign affiliates within the IG Group of companies pursuant to an arrangement under Regulation 32C of the Financial Advisers Regulations. Where the research is distributed in Singapore to a person who is not an Accredited Investor, Expert Investor or an Institutional Investor, IGA accepts legal responsibility for the contents of the report to such persons only to the extent required by law. Singapore recipients should contact IGA at 6390 5118 for matters arising from, or in connection with the information distributed.
The information/research herein is prepared by IG Asia Pte Ltd (IGA) and its foreign affiliated companies (collectively known as the IG Group) and is intended for general circulation only. It does not take into account the specific investment objectives, financial situation, or particular needs of any particular person. You should take into account your specific investment objectives, financial situation, and particular needs before making a commitment to trade, including seeking advice from an independent financial adviser regarding the suitability of the investment, under a separate engagement, as you deem fit.
No representation or warranty is given as to the accuracy or completeness of this information. Consequently, any person acting on it does so entirely at their own risk. Please see important Research Disclaimer.
Please also note that the information does not contain a record of our trading prices, or an offer of, or solicitation for, a transaction in any financial instrument. Any views and opinions expressed may be changed without an update.

Seize a share opportunity today
Go long or short on thousands of international stocks.
- Increase your market exposure with leverage
- Get spreads from just 0.1% on major global shares
- Trade CFDs straight into order books with direct market access
Live prices on most popular markets
- Forex
- Shares
- Indices
See more forex live prices
See more shares live prices
Prices above are subject to our website terms and agreements. Prices are indicative only. All shares prices are delayed by at least 15 mins.
See more indices live prices
Prices above are subject to our website terms and agreements. Prices are indicative only. All shares prices are delayed by at least 20 mins.
