Gold, oil and corn prices all drop back
Commodity prices have come under pressure, with the downtrends in oil and corn reasserting themselves.

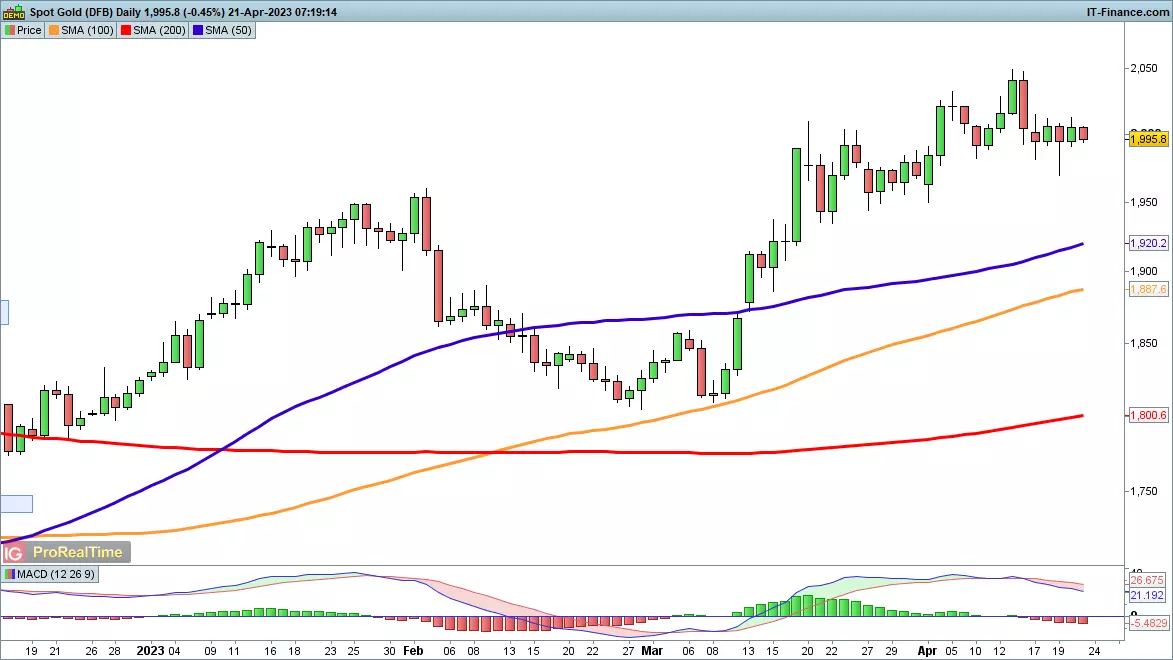
Gold drops back below $2000
The gold price has stabilised after Wednesday’s drop and recovery, though a declining MACD may well stay the buyers’ hand for now.
Should a bigger retracement develop, then the 50-day and 100-day simple moving averages (SMAs) come back into play as possible support. Having created higher highs in February and April, and a higher low in February, the uptrend is firmly intact.
Fresh gains would target $2050 and then the 2022 peak at $2070.
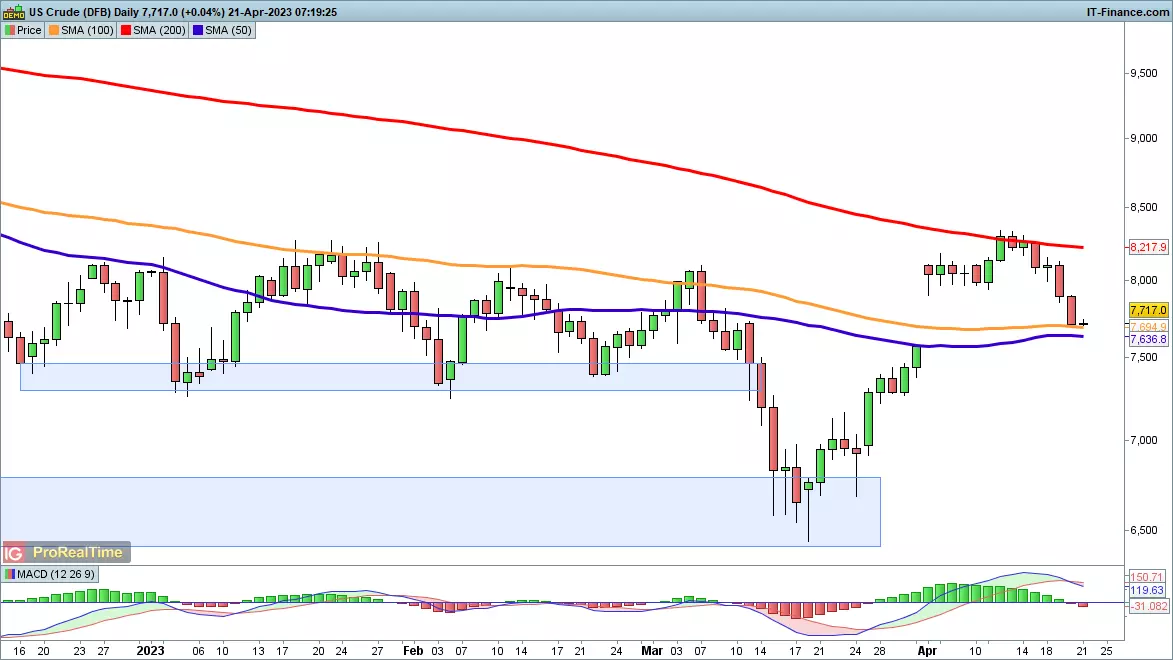
WTI falls back to 100-day MA
The oil price is now filling the gap created by OPEC’s surprise decision to cut output at the end of March.
This arguably revives the bearish thesis, with the price now below the $80 mark that was the high in early March. Additional declines below the 100- and 50-day SMAs would then potentially open the way to an eventual test of the March lows at $65.
Buyers will want to see a recovery above $80 and then a move on above the 200-day SMA to help recover a more bullish view.
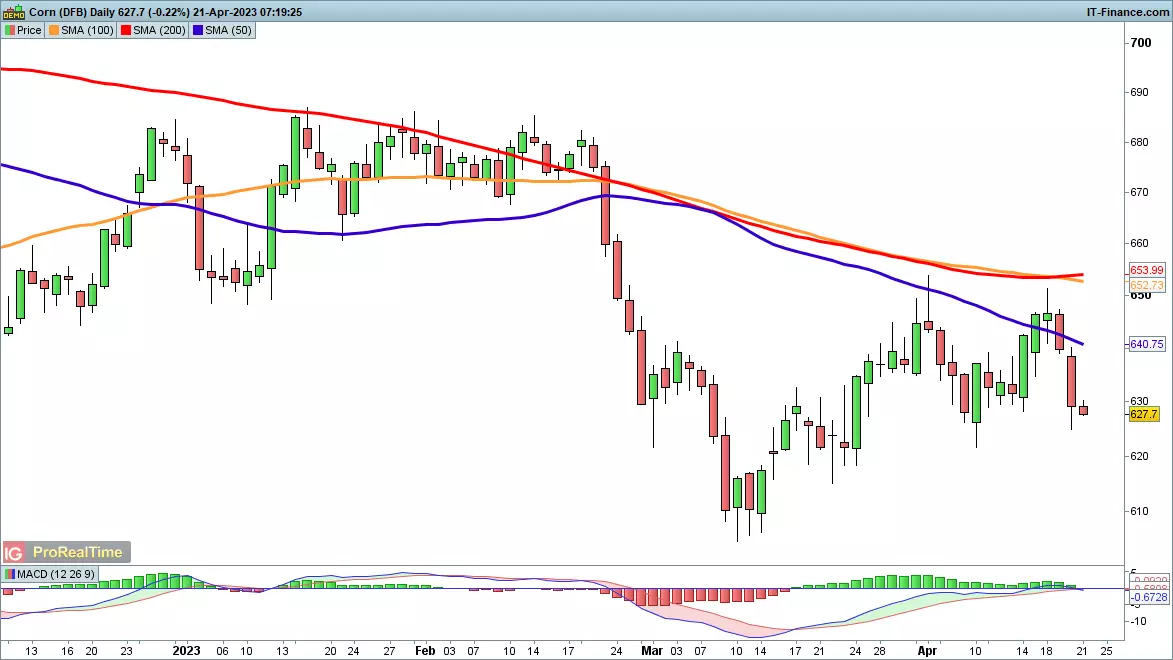
Corn heads lower
Two attempts in April to clear 650 have run out of momentum, and with the price now back below the 50-day SMA it looks like a move back towards 610 could be developing.
The downtrend is still in place with the failure to move back above 650, and the declining 50-day SMA points towards a continued bearish view.
A rally above 650 would then open the way to the February highs around 685.
IGA, may distribute information/research produced by its respective foreign affiliates within the IG Group of companies pursuant to an arrangement under Regulation 32C of the Financial Advisers Regulations. Where the research is distributed in Singapore to a person who is not an Accredited Investor, Expert Investor or an Institutional Investor, IGA accepts legal responsibility for the contents of the report to such persons only to the extent required by law. Singapore recipients should contact IGA at 6390 5118 for matters arising from, or in connection with the information distributed.
The information/research herein is prepared by IG Asia Pte Ltd (IGA) and its foreign affiliated companies (collectively known as the IG Group) and is intended for general circulation only. It does not take into account the specific investment objectives, financial situation, or particular needs of any particular person. You should take into account your specific investment objectives, financial situation, and particular needs before making a commitment to trade, including seeking advice from an independent financial adviser regarding the suitability of the investment, under a separate engagement, as you deem fit.
No representation or warranty is given as to the accuracy or completeness of this information. Consequently, any person acting on it does so entirely at their own risk. Please see important Research Disclaimer.
Please also note that the information does not contain a record of our trading prices, or an offer of, or solicitation for, a transaction in any financial instrument. Any views and opinions expressed may be changed without an update.

Seize a share opportunity today
Go long or short on thousands of international stocks.
- Increase your market exposure with leverage
- Get spreads from just 0.1% on major global shares
- Trade CFDs straight into order books with direct market access
Live prices on most popular markets
- Forex
- Shares
- Indices
See more forex live prices
See more shares live prices
Prices above are subject to our website terms and agreements. Prices are indicative only. All shares prices are delayed by at least 15 mins.
See more indices live prices
Prices above are subject to our website terms and agreements. Prices are indicative only. All shares prices are delayed by at least 20 mins.
