EUR/USD stabilises while EUR/JPY, USD/JPY rally
EUR/USD finds minor support while EUR/JPY, USD/JPY rally amid escalating tensions in the Middle East.


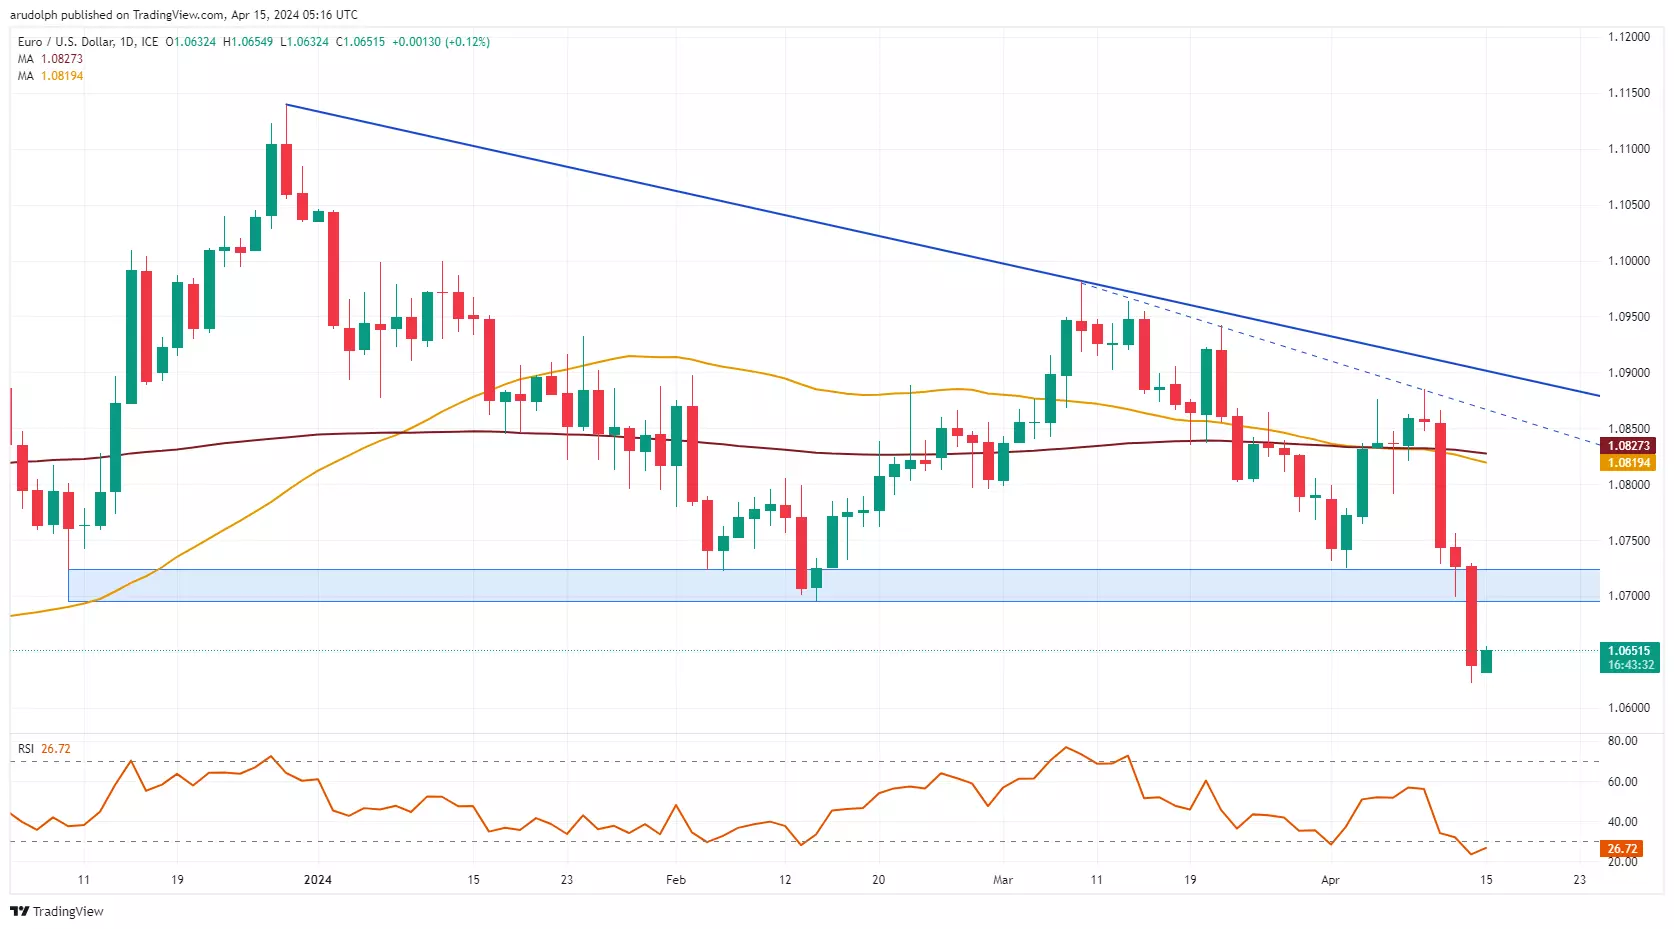
EUR/USD last week turned medium-term bearish
Friday's EUR/USD fall through and daily chart close below its $1.0694 February low confirmed the resumption of the medium-term bear market which began in December with the $1.05 region being in focus.
A slip through Friday's $1.0623 low would likely engage late October lows at $1.0522 to $1.0517 which represent the next downside targets ahead of the $1.0449 October trough. Short-term a minor bounce back towards the major previous $1.0695 to $1.074 support zone, now because of inverse polarity a resistance zone, may ensue but it is expected to cap.
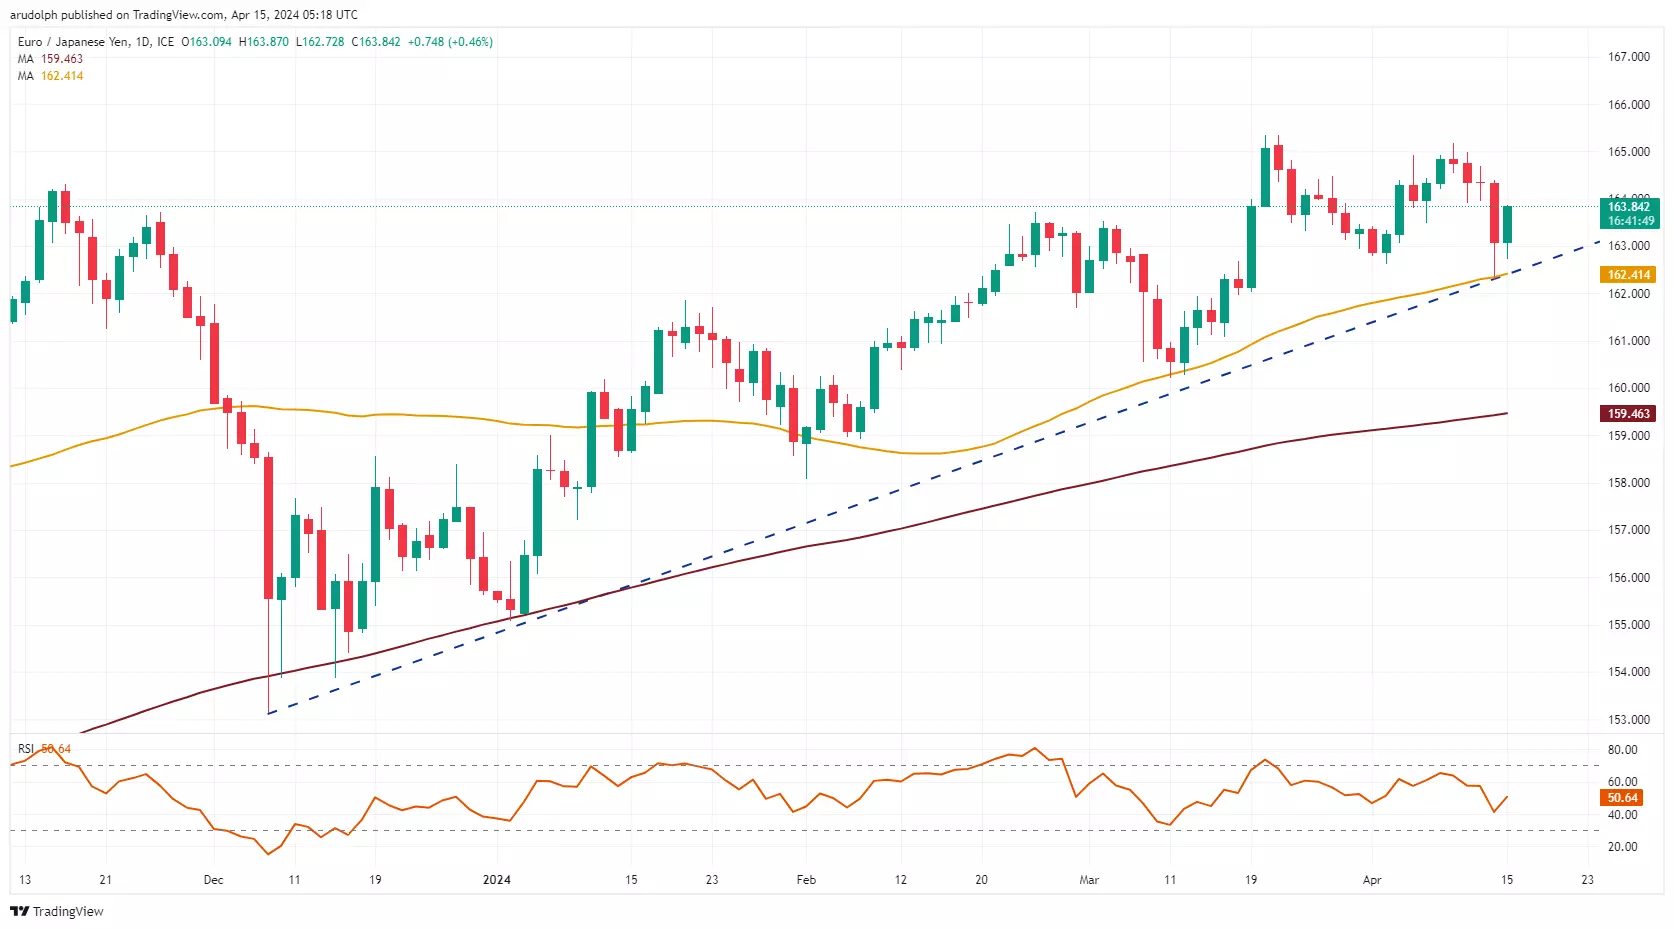
EUR/JPY resumes its ascent
EUR/JPY's swift reversal to the upside on Monday morning makes us question Friday's toppish outlook which we'll put on the back burner unless a fall through last week's low at ¥162.28 were to be seen.
Only in this scenario would the January high at ¥161.87 be back in sight. The 10 April low at ¥163.91 represents the next upside target ahead of the key ¥165.17 to ¥165.35 March and current April highs.
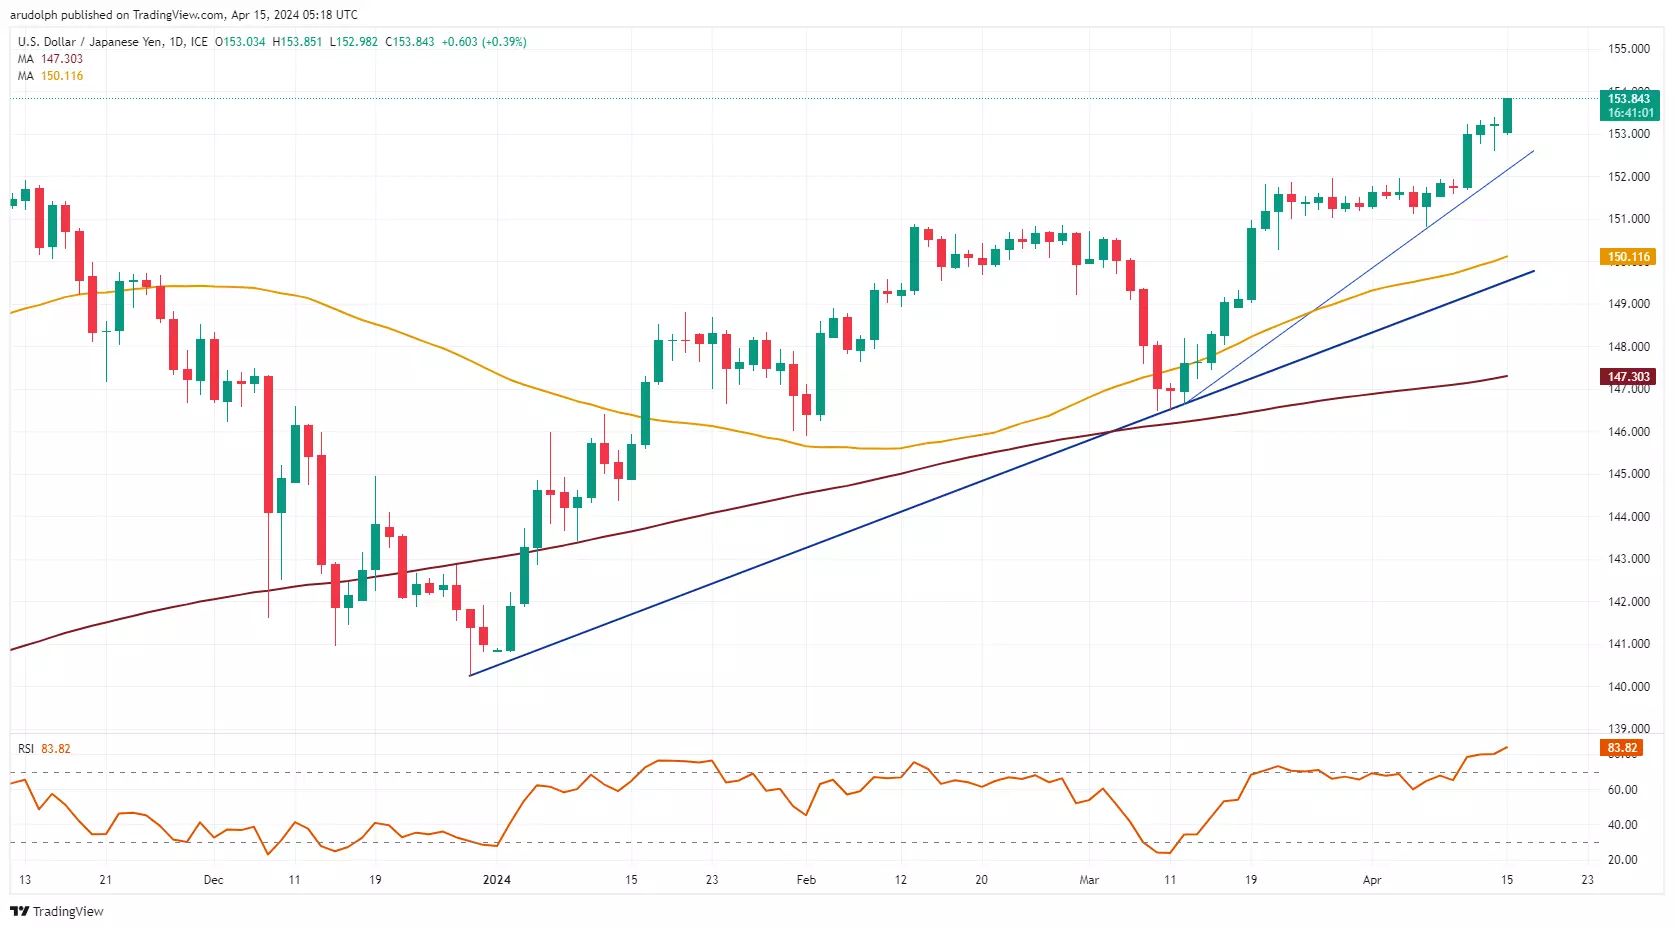
USD/JPY trades in new 34-year highs
USD/JPY's rise above its ¥153.60 July 1987 peak puts the ¥154.00 mark on the map, above which beckons the ¥155.00 region.
Immediate upside pressure will remain in play while Friday's low at ¥152.60 underpins. Were this level to give way, however, the the ¥151.97-91 area might be eyed. Further down sits the ¥150.88-81 support zone.
IGA, may distribute information/research produced by its respective foreign affiliates within the IG Group of companies pursuant to an arrangement under Regulation 32C of the Financial Advisers Regulations. Where the research is distributed in Singapore to a person who is not an Accredited Investor, Expert Investor or an Institutional Investor, IGA accepts legal responsibility for the contents of the report to such persons only to the extent required by law. Singapore recipients should contact IGA at 6390 5118 for matters arising from, or in connection with the information distributed.
The information/research herein is prepared by IG Asia Pte Ltd (IGA) and its foreign affiliated companies (collectively known as the IG Group) and is intended for general circulation only. It does not take into account the specific investment objectives, financial situation, or particular needs of any particular person. You should take into account your specific investment objectives, financial situation, and particular needs before making a commitment to trade, including seeking advice from an independent financial adviser regarding the suitability of the investment, under a separate engagement, as you deem fit.
No representation or warranty is given as to the accuracy or completeness of this information. Consequently, any person acting on it does so entirely at their own risk. Please see important Research Disclaimer.
Please also note that the information does not contain a record of our trading prices, or an offer of, or solicitation for, a transaction in any financial instrument. Any views and opinions expressed may be changed without an update.

Start trading forex today
Trade the largest and most volatile financial market in the world.
- Spreads start at just 0.6 points on EUR/USD
- Analyse market movements with our essential selection of charts
- Speculate from a range of platforms, including on mobile
Live prices on most popular markets
- Forex
- Shares
- Indices
See more forex live prices
See more shares live prices
Prices above are subject to our website terms and agreements. Prices are indicative only. All shares prices are delayed by at least 15 mins.
See more indices live prices
Prices above are subject to our website terms and agreements. Prices are indicative only. All shares prices are delayed by at least 20 mins.
