EUR/USD and EUR/GBP struggle as GBP/USD heads lower
The euro continues to be under pressure against both the dollar and the pound while GBP/USD formed a minor top.


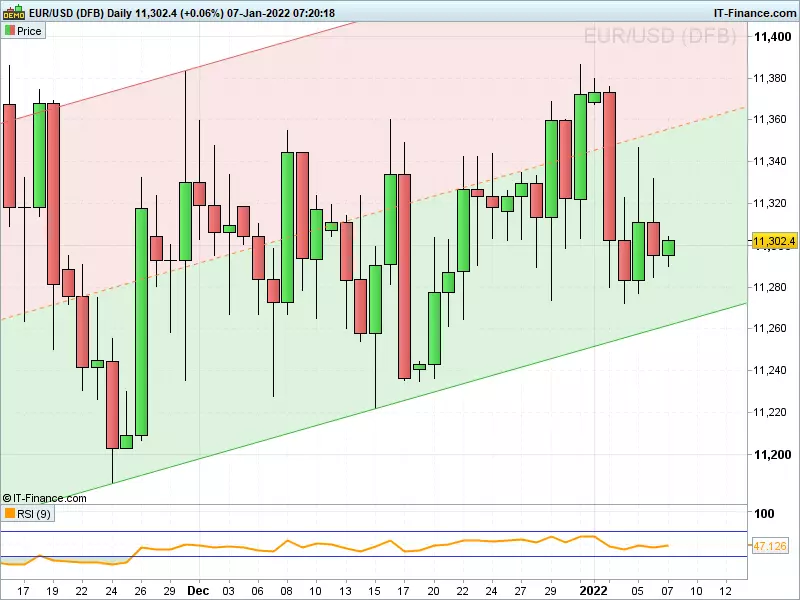
EUR/USD continues to struggle
EUR/USD continues to be subdued and still has the late-December low and also the November-to-December channel support line at $1.1274 to $1.1262 in its sights. Further support lies between the 7 and 20 December lows at $1.1237 to $1.1222, as well as at the November low at $1.1186 which remains in focus as well.
Immediate downside pressure should be maintained while the cross stays below the $1.1346 level, the 5 January high. Only a currently unexpected advance above this level would put the mid-December and 29 December highs at $1.136 to $1.1369 back on the plate.
Key resistance remains to be seen between the late-November and December peaks at $1.1382 to $1.1386. While the cross stays below it, the one-year downtrend stays firmly entrenched.
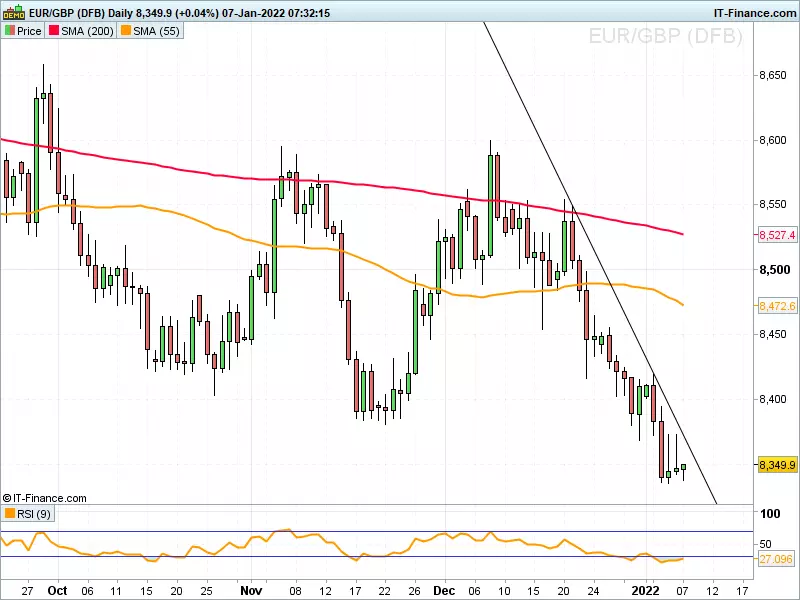
EUR/GBP looks towards recent lows
EUR/GBP weighs on this year’s low to date at £0.8335, a slide through which would eye the December 2016, April 2017, December 2019 and February 2020 lows at £0.8313 to £0.8277. This area represents key long-term support which is expected to withstand the first test.
Initial resistance remains to be seen between the October and November lows at £0.8381 to £0.8403. While the next higher early-January high at £0.8418 isn’t overcome, the downtrend which has been in place since September last year, remains intact.
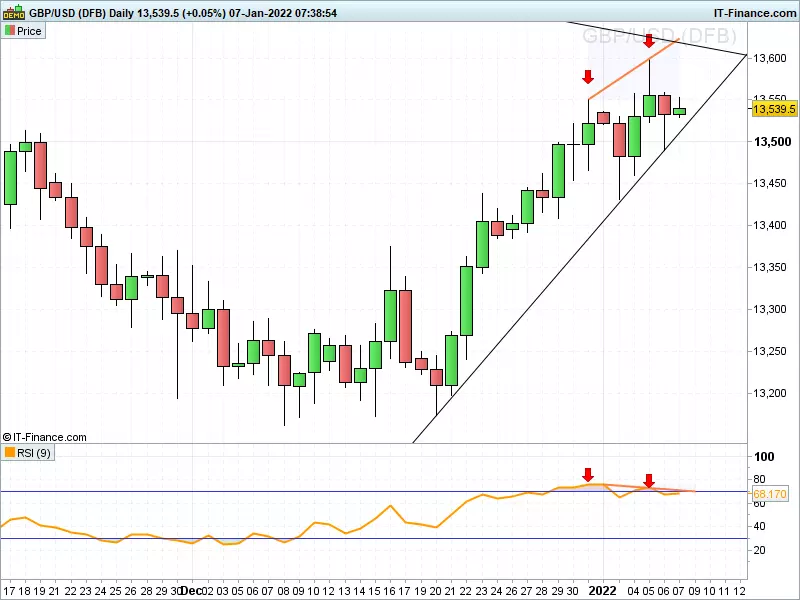
GBP/USD forms a short-term top
GBP/USD formed a minor top at $1.3598 in early January which has been accompanied by negative divergence on the daily 9-period RSI, pointing towards lower levels being seen.
A retest of the one-month uptrend line at $1.351 is likely to unfold while $1.3598 caps with yesterday’s low at $1.3499, representing another technical target. Failure there would probably push the $1.3412 to $1.3402 support zone to the fore. It consists of the late-September low and the 38.2% Fibonacci retracement of the December advance.
Further, more significant support can be found between the mid-November low and the late-November to mid-December highs as well as the 50% retracement at $1.3375 to $1.3353.
IGA, may distribute information/research produced by its respective foreign affiliates within the IG Group of companies pursuant to an arrangement under Regulation 32C of the Financial Advisers Regulations. Where the research is distributed in Singapore to a person who is not an Accredited Investor, Expert Investor or an Institutional Investor, IGA accepts legal responsibility for the contents of the report to such persons only to the extent required by law. Singapore recipients should contact IGA at 6390 5118 for matters arising from, or in connection with the information distributed.
The information/research herein is prepared by IG Asia Pte Ltd (IGA) and its foreign affiliated companies (collectively known as the IG Group) and is intended for general circulation only. It does not take into account the specific investment objectives, financial situation, or particular needs of any particular person. You should take into account your specific investment objectives, financial situation, and particular needs before making a commitment to trade, including seeking advice from an independent financial adviser regarding the suitability of the investment, under a separate engagement, as you deem fit.
No representation or warranty is given as to the accuracy or completeness of this information. Consequently, any person acting on it does so entirely at their own risk. Please see important Research Disclaimer.
Please also note that the information does not contain a record of our trading prices, or an offer of, or solicitation for, a transaction in any financial instrument. Any views and opinions expressed may be changed without an update.

Start trading forex today
Trade the largest and most volatile financial market in the world.
- Spreads start at just 0.6 points on EUR/USD
- Analyse market movements with our essential selection of charts
- Speculate from a range of platforms, including on mobile
Live prices on most popular markets
- Forex
- Shares
- Indices
See more forex live prices
See more shares live prices
Prices above are subject to our website terms and agreements. Prices are indicative only. All shares prices are delayed by at least 15 mins.
See more indices live prices
Prices above are subject to our website terms and agreements. Prices are indicative only. All shares prices are delayed by at least 20 mins.
