EUR/USD, GBP/USD and USD/JPY head lower, as havens gain ground
EUR/USD and GBP/USD head lower as the dollar strengths, although USD/JPY is also on the back foot as traders favour yen as a haven.

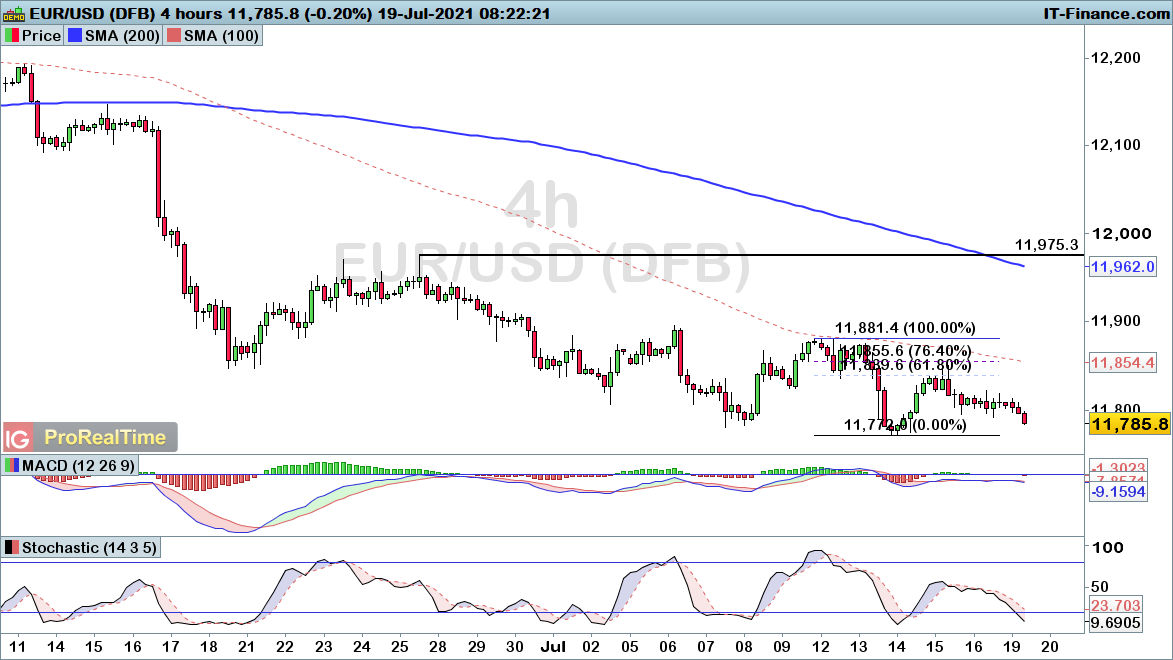
EUR/USD heading lower after recent retracement
EUR/USD is heading back down towards the $1.1772 support level this morning, with the pair building on the recent downtrend to post yet another deep retracement and subsequent sell-off.
With that in mind, we are looking for further short-term downside here, with a break up through the prior swing high of $1.1881 required to negate the ongoing bearish outlook.
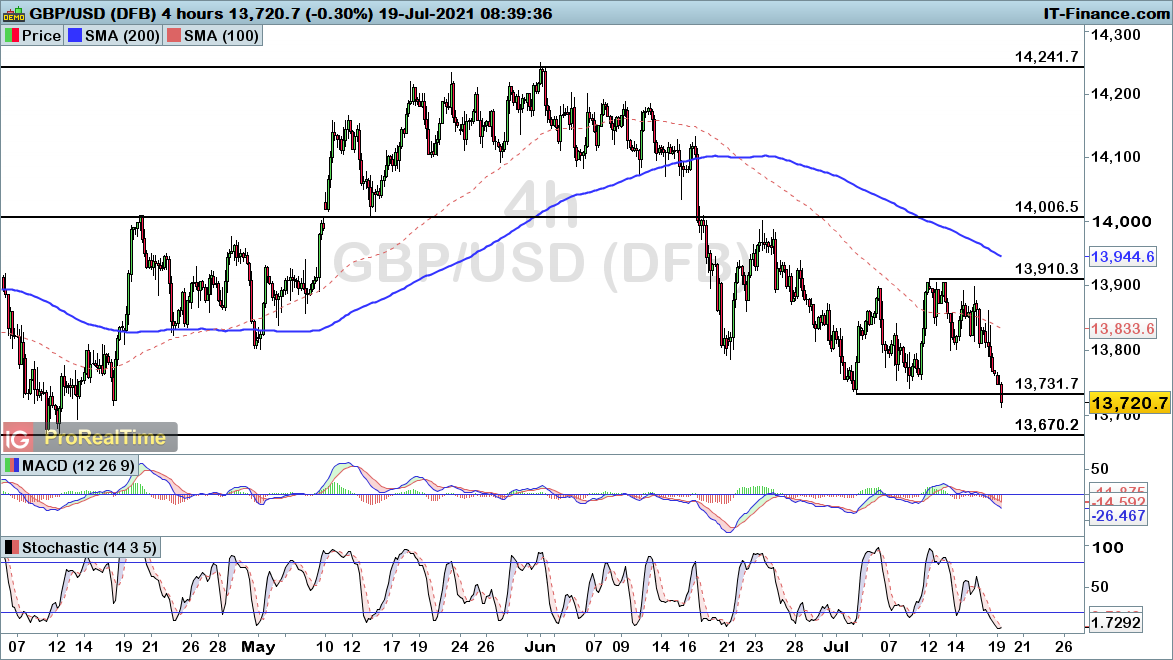
GBP/USD breaks support to bring three-month low
GBP/USD has slipped below $1.3731 this morning, with the selling pressure seen on Friday carrying into a new week. That break brings us a fresh three-month low, although we could go further than that if price manages to break below $1.367.
That support level represents the next major threshold to overcome, below which we would be looking t a five-month low. For now, the break below $1.3731 provides a bearish continuation signal, with a rise through $1.391 required to bring a more bullish view.
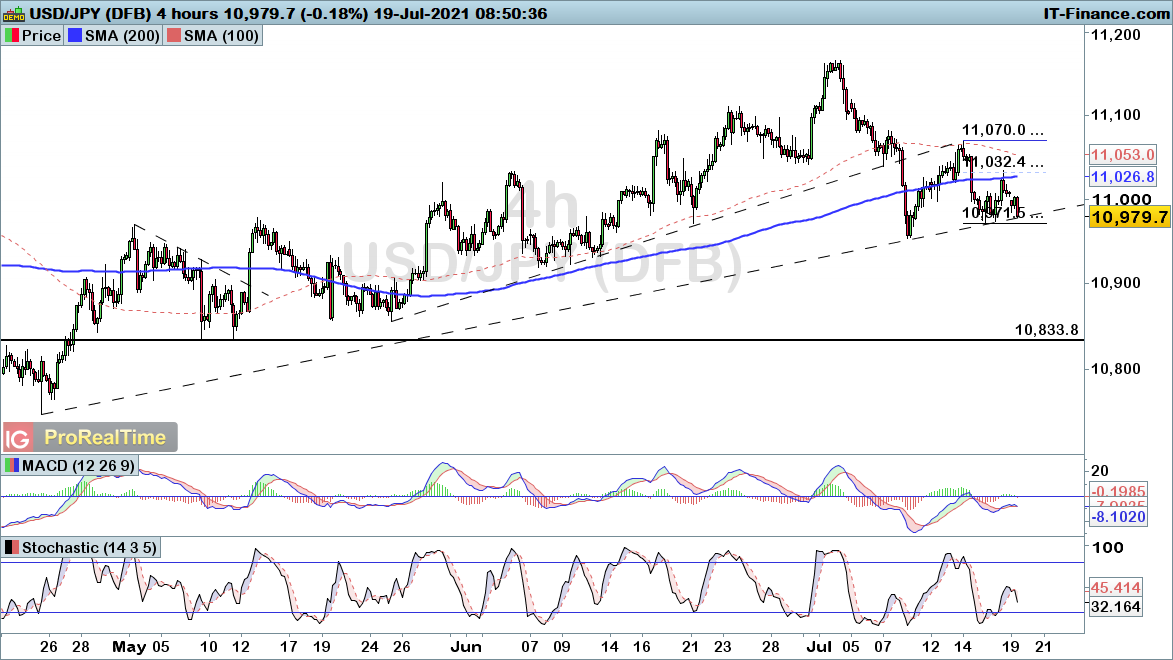
USD/JPY falls back towards key support
USD/JPY has slipped back into trendline support, following a failed rebound which ended at the 61.8% Fibonacci resistance level. The subsequent pullback has taken us back down into a confluence of ¥109.71 and trendline support.
That looks likely to bring another bout of significant losses if broken. As such, watch for a move back below the ¥109.71 level to provide a fresh bearish outlook for the days ahead. Conversely, a break up through the ¥110.70 level would be required to bring a more positive outlook for the pair.
IGA, may distribute information/research produced by its respective foreign affiliates within the IG Group of companies pursuant to an arrangement under Regulation 32C of the Financial Advisers Regulations. Where the research is distributed in Singapore to a person who is not an Accredited Investor, Expert Investor or an Institutional Investor, IGA accepts legal responsibility for the contents of the report to such persons only to the extent required by law. Singapore recipients should contact IGA at 6390 5118 for matters arising from, or in connection with the information distributed.
The information/research herein is prepared by IG Asia Pte Ltd (IGA) and its foreign affiliated companies (collectively known as the IG Group) and is intended for general circulation only. It does not take into account the specific investment objectives, financial situation, or particular needs of any particular person. You should take into account your specific investment objectives, financial situation, and particular needs before making a commitment to trade, including seeking advice from an independent financial adviser regarding the suitability of the investment, under a separate engagement, as you deem fit.
No representation or warranty is given as to the accuracy or completeness of this information. Consequently, any person acting on it does so entirely at their own risk. Please see important Research Disclaimer.
Please also note that the information does not contain a record of our trading prices, or an offer of, or solicitation for, a transaction in any financial instrument. Any views and opinions expressed may be changed without an update.

Start trading forex today
Trade the largest and most volatile financial market in the world.
- Spreads start at just 0.6 points on EUR/USD
- Analyse market movements with our essential selection of charts
- Speculate from a range of platforms, including on mobile
Live prices on most popular markets
- Forex
- Shares
- Indices
See more forex live prices
See more shares live prices
Prices above are subject to our website terms and agreements. Prices are indicative only. All shares prices are delayed by at least 15 mins.
See more indices live prices
Prices above are subject to our website terms and agreements. Prices are indicative only. All shares prices are delayed by at least 20 mins.
