EUR/USD, EUR/JPY and USD/JPY rally as BoJ keeps interest rates unchanged
Outlook on EUR/USD, EUR/JPY and USD/JPY as BoJ sticks to its ultra-loose monetary policy and provides no guidance for 2024.


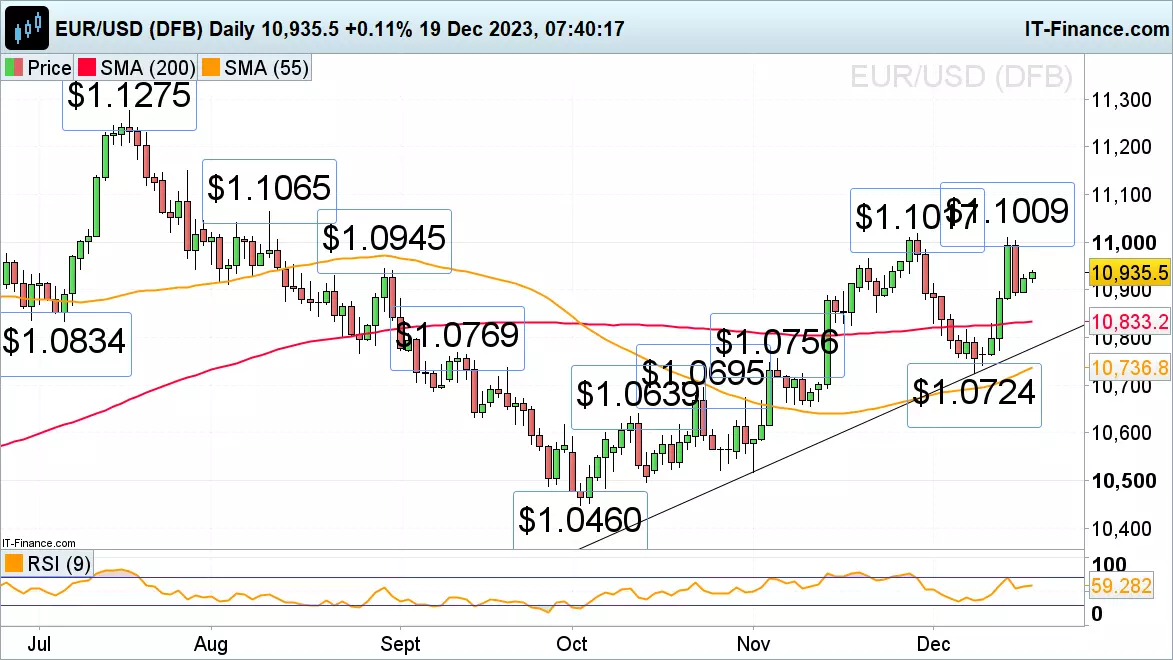
EUR/USD resumes ascent
EUR/USD's drop from last week’s $1.1009 high seems to have found support at Friday’s $1.0889 low with the cross resuming its ascent amid quiet trading as the festive season is getting closer.
The late August high at $1.0945 is back in sight, a rise above which would put the recent highs at $1.1009 to $1.1017 on the cards. Further up lurks the 10 August high at $1.1065.
Were Friday’s low at $1.0889 and the 14 November high at $1.0887 to give way, though, the 22 November low at $1.0852 could be reached instead.
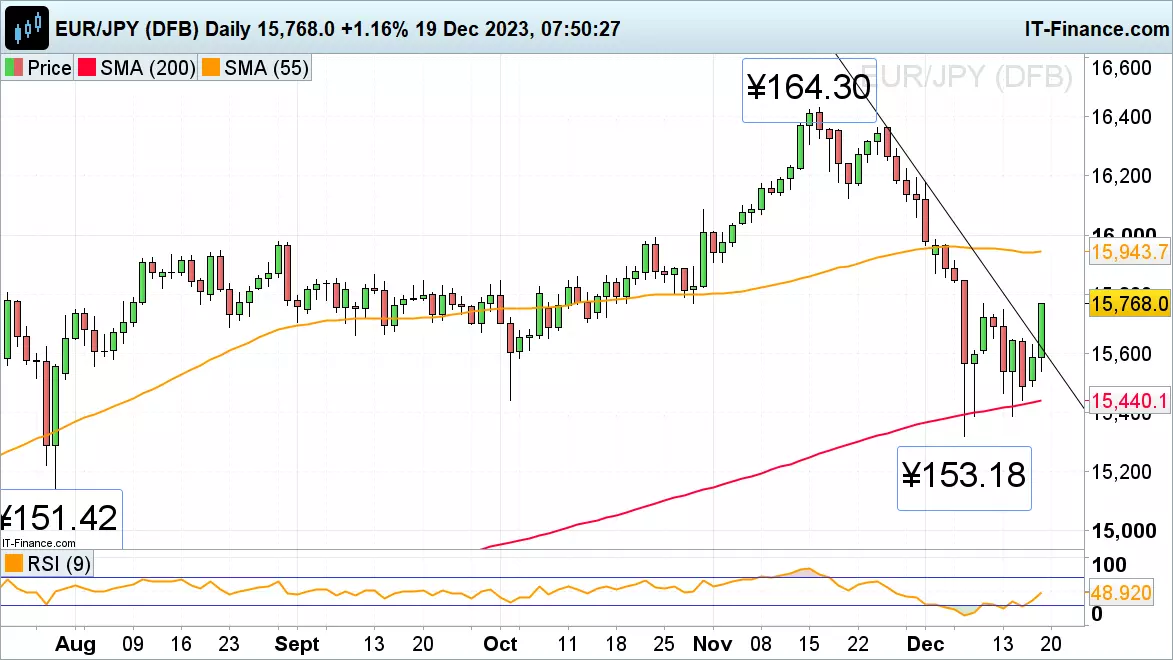
EUR/JPY rallies as BoJ sticks to ultra-loose monetary policy
EUR/JPY’s saw a swift ascent as the Bank of Japan (BoJ) stuck to its ultra-loose monetary policy and provided no guidance on whether it may move away from it next year.
EUR/JPY shot back up to its 11 December high and late October low at ¥157.68 to ¥157.70. Were this resistance area to be exceeded, the 55-day simple moving average (SMA) at ¥159.43 could be reached.
Minor support sits at Thursday and Friday’s highs at ¥156.49 to ¥156.48.
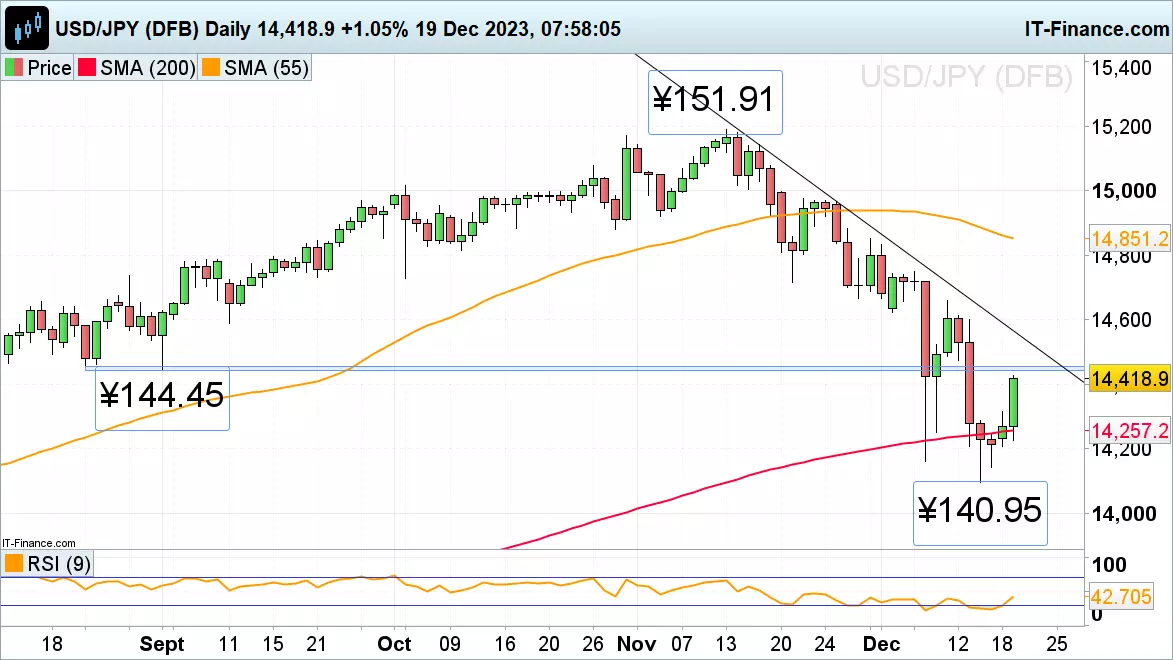
USD/JPY surges higher from last week’s five-month low
USD/JPY rapidly regained lost ground from last week’s ¥140.95 five month low as the BoJ kept its short-term rates at -0.1%, and that of the 10-year government bond yields around 0%. The central bank also retained a loose upper band of 1.0% for its long-term government yield.
USD/JPY nears the late August and September lows at ¥144.45 to ¥144.54 which may short-term cap. If not, the November-to-December downtrend line at ¥145.66 could be reached.
Potential slips should find support around Monday’s high at ¥143.16.
IGA, may distribute information/research produced by its respective foreign affiliates within the IG Group of companies pursuant to an arrangement under Regulation 32C of the Financial Advisers Regulations. Where the research is distributed in Singapore to a person who is not an Accredited Investor, Expert Investor or an Institutional Investor, IGA accepts legal responsibility for the contents of the report to such persons only to the extent required by law. Singapore recipients should contact IGA at 6390 5118 for matters arising from, or in connection with the information distributed.
The information/research herein is prepared by IG Asia Pte Ltd (IGA) and its foreign affiliated companies (collectively known as the IG Group) and is intended for general circulation only. It does not take into account the specific investment objectives, financial situation, or particular needs of any particular person. You should take into account your specific investment objectives, financial situation, and particular needs before making a commitment to trade, including seeking advice from an independent financial adviser regarding the suitability of the investment, under a separate engagement, as you deem fit.
No representation or warranty is given as to the accuracy or completeness of this information. Consequently, any person acting on it does so entirely at their own risk. Please see important Research Disclaimer.
Please also note that the information does not contain a record of our trading prices, or an offer of, or solicitation for, a transaction in any financial instrument. Any views and opinions expressed may be changed without an update.

Start trading forex today
Trade the largest and most volatile financial market in the world.
- Spreads start at just 0.6 points on EUR/USD
- Analyse market movements with our essential selection of charts
- Speculate from a range of platforms, including on mobile
Live prices on most popular markets
- Forex
- Shares
- Indices
See more forex live prices
See more shares live prices
Prices above are subject to our website terms and agreements. Prices are indicative only. All shares prices are delayed by at least 15 mins.
See more indices live prices
Prices above are subject to our website terms and agreements. Prices are indicative only. All shares prices are delayed by at least 20 mins.
