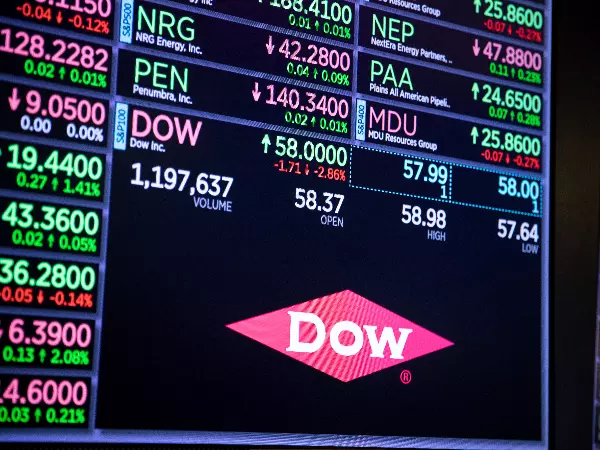
Market update: Dow Jones, S&P 500 pullback may accelerate as retail traders become bullish
Dow Jones, S&P 500 have been weakening of late; retail traders still mostly short, but upside bets rise and this could leave Wall Street further vulnerable ahead.

The Dow Jones and S&P 500 have been aiming cautiously lower in recent days. In response, retail traders have started to increase their upside exposure. This can be seen by looking at IG Client Sentiment (IGCS). IGCS tends to function as a contrarian indicator.
Dow Jones sentiment outlook: Bearish
According to IGCS, only about 27% of retail traders are net-long the Dow Jones. Since the majority of them are biased lower, this still hints that prices may continue climbing down the road.
However, upside exposure has increased by 7.14% and 8.65% compared to yesterday and last week, respectively. With that in mind, recent changes in sentiment warn that the Dow Jones might soon reverse lower.
Wall Street client positioning chart

Dow Jones technical analysis
On the daily chart, the Dow Jones was unable to surpass the February 2022 high of 25,752, and it now appears that the next move could be a downward turn. This possibility is reinforced by the presence of negative RSI divergence, indicating a diminishing upside momentum.
The 20-day Moving Average (MA) serves as immediate support, and if the price falls below it, it will reveal the ascending support from October.
Dow Jones daily chart

S&P 500 sentiment outlook: Bearish
According to IGCS, about 36% of retail traders are net-long the S&P 500. Since most of them are biased to the downside, this still suggests that prices may continue rising down the road. But, upside exposure has increased by 9.42% and 23.19% compared to yesterday and last week, respectively.
With that in mind, recent changes in positioning warn that the S&P 500 may soon reverse lower despite overall exposure.
US 500 client positioning chart

S&P 500 technical analysis
The S&P 500 has fallen for three consecutive days, weakening about 1.5%. That marks the worst three-day period since early March. Prices also broke under and confirmed a push through the 20-day Moving Average. That has exposed immediate support at 4446 which is the 23.6% Fibonacci retracement level and the 50-day MA. Clearing under the latter opens the door to a stronger bearish technical bias.
S&P 500 daily chart

This information has been prepared by DailyFX, the partner site of IG offering leading forex news and analysis. In addition to the disclaimer below, the material on this page does not contain a record of our trading prices, or an offer of, or solicitation for, a transaction in any financial instrument. IG accepts no responsibility for any use that may be made of these comments and for any consequences that result. No representation or warranty is given as to the accuracy or completeness of this information. Consequently any person acting on it does so entirely at their own risk. Any research provided does not have regard to the specific investment objectives, financial situation and needs of any specific person who may receive it. It has not been prepared in accordance with legal requirements designed to promote the independence of investment research and as such is considered to be a marketing communication. Although we are not specifically constrained from dealing ahead of our recommendations we do not seek to take advantage of them before they are provided to our clients.
IGA, may distribute information/research produced by its respective foreign affiliates within the IG Group of companies pursuant to an arrangement under Regulation 32C of the Financial Advisers Regulations. Where the research is distributed in Singapore to a person who is not an Accredited Investor, Expert Investor or an Institutional Investor, IGA accepts legal responsibility for the contents of the report to such persons only to the extent required by law. Singapore recipients should contact IGA at 6390 5118 for matters arising from, or in connection with the information distributed.
The information/research herein is prepared by IG Asia Pte Ltd (IGA) and its foreign affiliated companies (collectively known as the IG Group) and is intended for general circulation only. It does not take into account the specific investment objectives, financial situation, or particular needs of any particular person. You should take into account your specific investment objectives, financial situation, and particular needs before making a commitment to trade, including seeking advice from an independent financial adviser regarding the suitability of the investment, under a separate engagement, as you deem fit.
No representation or warranty is given as to the accuracy or completeness of this information. Consequently, any person acting on it does so entirely at their own risk. Please see important Research Disclaimer.
Please also note that the information does not contain a record of our trading prices, or an offer of, or solicitation for, a transaction in any financial instrument. Any views and opinions expressed may be changed without an update.
Live prices on most popular markets
- Forex
- Shares
- Indices
See more forex live prices
See more shares live prices
Prices above are subject to our website terms and agreements. Prices are indicative only. All shares prices are delayed by at least 15 mins.
See more indices live prices
Prices above are subject to our website terms and agreements. Prices are indicative only. All shares prices are delayed by at least 20 mins.
