Does buying Shell shares ahead of Q2 results make sense?
Is now a good time to buy Shell shares as the Jackdaw gas field project begins?
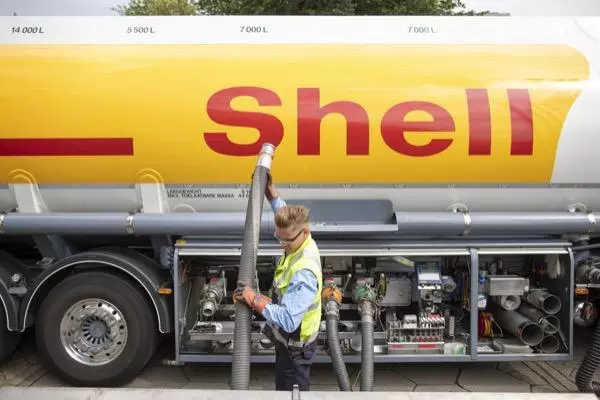

Is now a good time to buy Shell shares as the Jackdaw gas field project begins?
Shell PLC (SHEL.L) said on Monday that it will go ahead and develop the Jackdaw gas field in the British North Sea, which has been opposed by environmental groups, but which received regulatory approval in June after Shell changed its environmental development plan.
The field, which has reserves of between 120 million and 250 million barrels of oil equivalent, is expected to come online by the second half of 2025 and could provide 6.5% of Britain’s gas output at a time when the UK tries to become more energy self-sufficient and less reliant on gas imports.
Shell, as one of the biggest companies on the London Stock Exchange (LSE) with a market capitalisation of £150 billion, second only to AstraZeneca PLC, like its rivals is actively exploring the transition from fossil fuels to alternative energy sources. If demand for oil were to decline, this strategy could turn out to be a smart way of diversifying Shell’s earnings. For now, the demand for energy remains high, though, and should continue to greatly contribute to the British oil and gas company’s coffers.
Shell’s second quarter (Q2) earnings are expected to be published on Thursday with revenue estimated to come in at £100.85 billion, up nearly 67% year-on-year (YoY), with a Q2 pre-tax profit of £10.71 billion, up 45% compared to a year ago.
According to Reuters Refinitiv data five analysts rate the share as a ‘strong buy’, 16 as a ‘buy’ and three as a ‘hold’ with a median long-term price target of 2,789.5 pence, up around 33% from current levels (as of 27 July 2022).

Technical analysis outlook of the Shell share price
Like other oil and gas companies Shell has been greatly outperforming the FTSE 100 and still trades around 23% higher year-to-date, despite its over 20% slump from its early June high.
When looking at the weekly price chart one can see that the decline can be sub-divided into three corrective Elliott waves, A, B and C, with the C-leg low formed in early July at 1,909p.
If the recent sell-off is only corrective in nature, a five-wave advance to above its June peak at 2,459p should unfold.

It is of interest to analysts that the early July low was made close to the 200-day simple moving average (SMA) which acted as support. Stocks which trade above their 200-day SMA are considered to be bullish.
From a longer-term perspective the Shell share price remains in an uptrend as it continues to trade above its 2020-to-2022 uptrend line at 1,894p and its March low at 1,818p.
On the daily chart, the fact that the Shell share price has managed to rise above its two-month downtrend line at 2,026p and also above its 2,081 8 July high, is technically short-term bullish with the 55-day SMA and the late June high at 2,194p to 2,238p being in the limelight.
The current bullish upside momentum should remain in play while the share remains within its short-term uptrend channel and above its last reaction low at Monday’s 2,002 low on a daily chart closing basis. Were this level to unexpectedly give way, the early July low at 1,909p would be back in the frame as well as the 2020-to-2022 uptrend line at 1,894p.

IGA, may distribute information/research produced by its respective foreign affiliates within the IG Group of companies pursuant to an arrangement under Regulation 32C of the Financial Advisers Regulations. Where the research is distributed in Singapore to a person who is not an Accredited Investor, Expert Investor or an Institutional Investor, IGA accepts legal responsibility for the contents of the report to such persons only to the extent required by law. Singapore recipients should contact IGA at 6390 5118 for matters arising from, or in connection with the information distributed.
The information/research herein is prepared by IG Asia Pte Ltd (IGA) and its foreign affiliated companies (collectively known as the IG Group) and is intended for general circulation only. It does not take into account the specific investment objectives, financial situation, or particular needs of any particular person. You should take into account your specific investment objectives, financial situation, and particular needs before making a commitment to trade, including seeking advice from an independent financial adviser regarding the suitability of the investment, under a separate engagement, as you deem fit.
No representation or warranty is given as to the accuracy or completeness of this information. Consequently, any person acting on it does so entirely at their own risk. Please see important Research Disclaimer.
Please also note that the information does not contain a record of our trading prices, or an offer of, or solicitation for, a transaction in any financial instrument. Any views and opinions expressed may be changed without an update.

Seize a share opportunity today
Go long or short on thousands of international stocks.
- Increase your market exposure with leverage
- Get spreads from just 0.1% on major global shares
- Trade CFDs straight into order books with direct market access
Live prices on most popular markets
- Forex
- Shares
- Indices
See more forex live prices
See more shares live prices
Prices above are subject to our website terms and agreements. Prices are indicative only. All shares prices are delayed by at least 15 mins.
See more indices live prices
Prices above are subject to our website terms and agreements. Prices are indicative only. All shares prices are delayed by at least 20 mins.
